
Fig. 5
- ID
- ZDB-FIG-110111-16
- Publication
- Feng et al., 2010 - Live Imaging of Innate Immune Cell Sensing of Transformed Cells in Zebrafish Larvae: Parallels between Tumor Initiation and Wound Inflammation
- Other Figures
- All Figure Page
- Back to All Figure Page
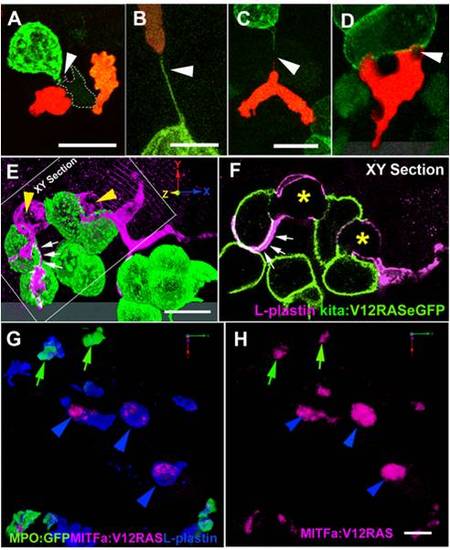
Dynamic interactions between leukocytes and V12RAS+ transformed cells. (A) A confocal image of a LysC:DsRed+ (red) cell and a macrophage (faint green with dotted outline) interacting with a V12RAS+ cell (green) (Video S8). (B and C) Images showing LysC:DsRed+ leukocytes establishing tethers with V12RAS+ cells, as observed in Tg(fli:eGFP, LysC:DsRed, kita:GalTA4, UAS:V12RASeGFP) larvae: (B) shows a tether entirely composed of V12RAS cytoplasm (green) (Video S9); (C) shows a chimeric tether composed of both V12RAS (green) and LysC:DsRed+ (red) cytoplasm. (D) A single image from a 3-D movie (Video S10) of a neutrophil as it glides over and engulfs pieces of a V12RAS+ cell; (E) 3-D reconstruction of a V12RAS+ cell clump (green cells) showing two macrophages (L-plastin+, magenta staining, yellow arrowheads) as they deform to engulf individual V12RAS+ cells. Small white arrows and dotted outline indicate lamellipodial protrusions extending over another pair of transformed cells. (F) A single focal plane (corresponding to that indicated in [E]) of the same pair of macrophages, showing V12RAS+-cell-shaped phagosomes (asterisks) within them. One macrophage has partially enveloped another V12RAS+ cell with a thin lamellipodial extension (indicated by small white arrows). (G) 3-D reconstruction of an anti-L-plastin-stained mitfa:V12RAS-mitfa:mCherry-injected Tg(BACmpo:eGFP)i114 larval flank region, showing the presence of mCherry+ (red) debris within L-plastin+MPO- cells. (H) Image as in (G) but with single channel to highlight the mCherry+V12RAS+ debris; green arrows indicate co-localization within L-plastin+MPO+ neutrophils; blue arrowheads indicate co-localization within L-plastin+MPO- macrophages. Note that the larger clumps of debris all reside within macrophages. Scale bars = 16 μm. |