
Fig. 3
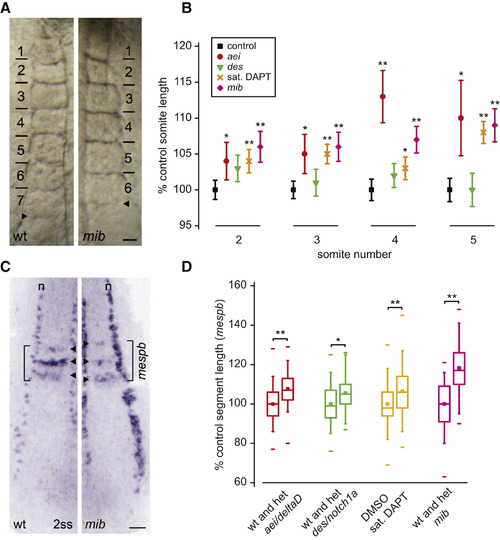
Segment Length Increases after Reduction in Delta-Notch Coupling (A) Somites of six-somite-stage live embryos. Bars indicate formed somite boundaries; arrowheads indicate forming boundaries. Dorsal view is anterior to top. The scale bar represents 25 μm. (B) Somite lengths (mean ± 95% CI), n ≥ 40 total embryos per experimental condition, except n = 14 for somite five in aei/deltaD, six independent trials per experimental condition. For control population, the largest CI detected is displayed. (C) In situ hybridization of mespb (arrowheads) and isl1 (interneurons, Rohon-Beard neurons, n). The scale bar represents 50 μm. (D) Box-and-whisker plots of segment length, n ≥ 40 total embryos, more than three independent trials per experimental condition. *p < 0.01, **p < 0.001, Student′s t test. Figure S3 shows that the position of the arrest front in the PSM is unchanged in the conditions with increased segment length. The central box covers the interquartile range with the mean indicated by the small square and the median by the line within the box. The whiskers extend to the 5th and 95th percentiles, and small bars depict the most extreme values. |
| Genes: | |
|---|---|
| Fish: | |
| Anatomical Terms: | |
| Stage: | 5-9 somites |
| Fish: | |
|---|---|
| Observed In: | |
| Stage: | 5-9 somites |