|
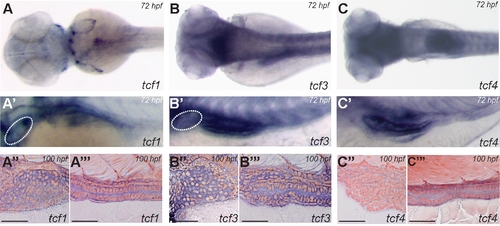
Tcf transcription factors tcf1, tcf3, and tcf4 have a distinctive expression pattern at 72 and 100 hpf. Dorsal view of 72 hpf wild-type fish after WISH for tcf1 (A), tcf3 (B), and tcf4 (C). Detail of lateral view (dorsal to the top) of 72 hpf wild-type fish after WISH for tcf1 (A′), tcf3 (B′), and tcf4 (C′). Histological analysis of sagittal sections of 100 hpf zebrafish larvae after whole-mount in situ for tcf1 (A″, A″′), tcf3 (B″, B″′), and tcf4 (C″, C″′), depicting expression of mRNA in the liver bud and intestinal epithelium, respectively. There is coexpression of tcf1, tcf3, and tcf4 in the intestinal epithelium at these developmental time points. White dashed line delimits domain of expression of tcf1 and tcf3 in liver bud (A′, B′), as confirmed by histological section (A″, B″). Scale bar corresponds to 50 μM.
|