
Fig. 4
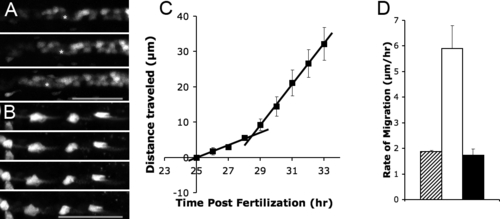
Timing of Pronephric Cell Migration (A) NaK ATPase:GFP transgenic showing initiation of cell migration after 29 hpf. Frame interval: 4.5 hr, scale bar: 70 μm. (B) Time-lapse of the CD41:GFP transgenic 5-dpf embryo showing cessation of migration. Frame interval: 2.5 hr, scale bar: 60μm. (C) A sharp increase in the distance traveled occurs at 28.5 hpf. The two regression lines intersect at 28.5 hpf. Each point represents distance traveled by epithelial cells between 25 hpf and a given time point. The data plotted represent averages from three different embryos (D) Comparative rates of epithelial migration before 28.5 hpf (striped bar), after 28.5hpf (white bar), and after 5 dpf (black bar). |
| Gene: | |
|---|---|
| Fish: | |
| Anatomical Term: | |
| Stage Range: | Prim-5 to Day 5 |