|
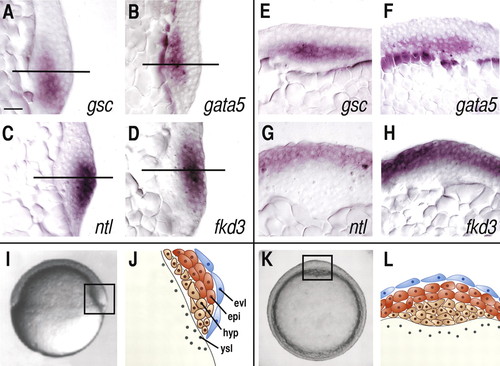
Expression patterns of marker genes for (neuro)ectodermal, mesodermal and endodermal progenitor cells within the shield region at the onset of gastrulation (60% epiboly). Sagittal (A-D) and frontal (E-H) sections of the shield region demarcating the expression domains of goosecoid (gsc; A,E), gata5 (B,F), notail (ntl; C,G) and forkhead3 (fkd3; D,H). The horizontal lines in A-D indicate the level where the frontal sections in E-H were taken. (I-L) Orientation of the embryos (I,K) and schematic representations (J,L) of the shield region (boxed areas in I,K), representing sagittal (I,J) and frontal (K,L) views of the shield as shown in panels A-D and E-H, respectively. Please note that number of cell layers depicted in the schematic diagrams is lower than in the real embryo (for details about cell layer numbers, see Results). epi, epiblast; hyp, hypoblast; evl, enveloping cell layer; ysl, yolk syncytial layer. Scale bar in A: 100 �m for A-H.
|