FIGURE
Fig. S3
Fig. S3
|
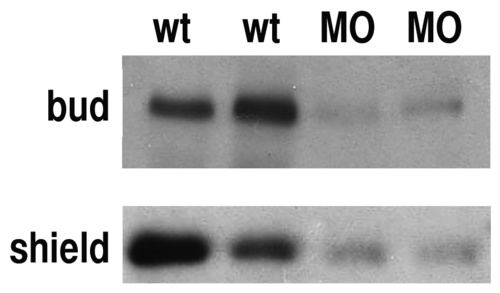
Western blot showing the total amounts of E-Cadherin protein from wild-type and e-cadherin morpholino (MO; 8ng)-injected embryos at bud (10 hpf) and shield (6 hpf) stages. The size of the band recognized corresponds to the predicted molecular weight for E-Cadherin (140 kDa) (Babb and Marrs, 2004). wt, wild type; MO, e-cadherin MO. Two independent samples for each condition with 10 embryos/sample were loaded. As a loading control, the gels were Commassie stained to check for equal amounts of protein in each lane. |
Expression Data
Expression Detail
Antibody Labeling
Phenotype Data
Phenotype Detail
Acknowledgments
This image is the copyrighted work of the attributed author or publisher, and
ZFIN has permission only to display this image to its users.
Additional permissions should be obtained from the applicable author or publisher of the image.
Full text @ Development

