- Title
-
Mindin/F-spondin family: novel ECM proteins expressed in the zebrafish embryonic axis
- Authors
- Higashijima, S., Nose, A., Eguchi, G., Hotta, Y., and Okamoto, H.
- Source
- Full text @ Dev. Biol.
|
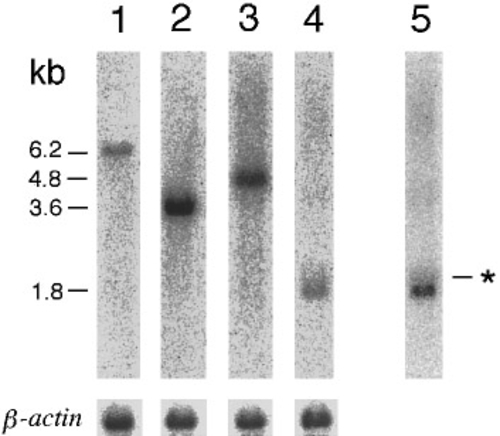
Northern blot analyses of F-spondin1, F-spondin2, mindin1, and mindin2. Four micrograms of poly(A)+ RNA isolated from 28-h embryos was run in each lane. Lane 1, F-spondin1; lane 2, F-spondin2; lane 3, mindin1; and lanes 4 and 5, mindin2. Exposure time was the same in lanes 1-4. Lane 5 represents a sixfold-longer exposure of lane 4. Asterist indicates minor transcripts of mindin2, approximately 2.0-2.3kb in size. β-actin indicates patterns of rehybridization with a β-actin probe. EXPRESSION / LABELING:
|
|
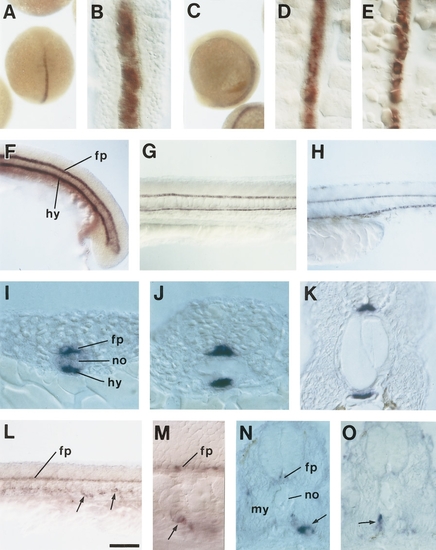
(A?K) mindin1 and (L?O) mindin2 mRNA expression in developing embryos. (A and B) mindin1 expression in 11-h embryos. Dorsal view. A higher magnification view of a dissected embryo is presented in B. Expression of mindin1 first appears in the axial mesodermal region. (C) Lateral view of an embryo at 13 h. (D) A dorsal view of a 14-h embryo in higher magnification. The focus is just dorsal to the notochord. A continuous row of cells, which are precursors of the floor plate cells, are labeled. (E) The same embryo shown in D. The focus is just ventral to the notochord. Noncontiguous cells, which are precursors of the hypochordal cells, are labeled. (F?H) Lateral views of 17- (F), 24- (G), and 33-h (H) embryos. Two contiguous rows of cells just dorsal or ventral to the notochord are labeled. The former is the floor plate and the latter is the hypochord. (I?K) Cross sections of 12- (I), 17- (J), and 30-h (K) embryos. In all developmental stages, mindin1 is expressed in the floor plate and the hypochord, either of which consists of a single row of cells. In the early stage (I), mindin1 is also expressed weakly in the notochord. (L and M) mindin2 expression in a 26-h embryo. Lateral view. A higher magnification view of the same embryo shown in L is presented in M. mindin2 is expressed in the floor plate cells. mindin2 is also expressed in the mesenchymal cells in the ventral region of the embryo (arrows). (N and O) Cross section of 32-h embryos. mindin2-positive mesenchymal cells are located between the ventral region of the myotome and endodermal cells (arrow in N) or between the ventral region of the notochord and the myotome (arrow in O). These cells are likely to be sclerotomal cells. fp, floor plate; no, notochord; hy, hypochord; my, myotome. Scale bar, 270 μm in A and C; 44 μm in B, D, and E; 100 μm in F?H and L; 17 μm in I?K, N, and O; and 33 μm in M. EXPRESSION / LABELING:
|
|
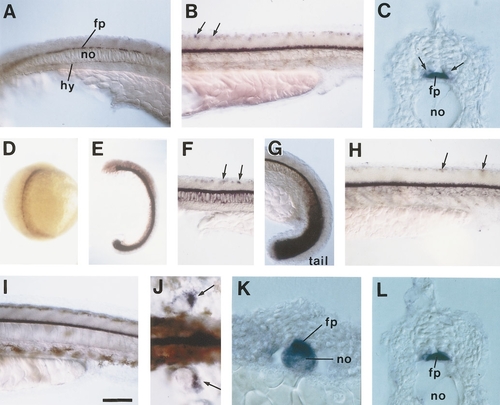
(A?C) F-spondin1 and (D?L) F-spondin2 mRNA expression in developing embryos. (A) Lateral view of a 20-h embryo. F-spondin1 is clearly expressed in the floor plate and weakly expressed in the hypochord. (B) Lateral view of a 28-h embryo. F-spondin1 is expressed around the floor plate. In addition, several dorsal cells in the spinal cord express F-spondin1 (arrows). (C) Cross section of a 28-h embryo. F-spondin1 is strongly expressed in the floor plate. In addition, F-spondin1 appears to be weakly expressed in the cells adjacent to the floor plate (arrows). (D) F-spondin2 expression in a 13-h embryo. Dorsal view. F-spondin2 is expressed around the axial mesoderm and weakly in the somites. (E) Lateral view of a 17-h embryo. (F and G) Lateral view of 19-h embryos in the trunk (F) and the tail (G). In addition to the expression around the floor plate, F-spondin2 is also weakly expressed in the notochord and strongly expressed in the tail bud. (H and I) Lateral view of 28- (H) and 36-h (I) embryos. Arrows in (F) and (H) indicate F-spondin2-positive cells in the dorsal spinal cord. (J) Dorsal view of a 36-h embryo in the pectoral fin bud region. F-spondin2 is expressed in the posterior region of the pectoral finbuds (arrows) (K) Cross section of a 15-h embryo. (L) Cross section of a 28-h embryo. fp, floor plate; no, notochord; hy, hypochord. Scale bar, 100 μm in A, B, and F?J; 17 μm in C, K, and L; 250 μm in D; and 160 μm in E. EXPRESSION / LABELING:
|
|
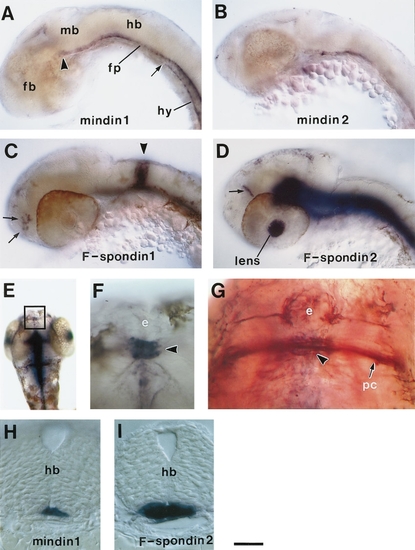
mRNA expression of mindin/F-spondin family in the head region. (A?D) Lateral view of the head region stained with mindin1 (A), mindin2 (B), F-spondin1 (C), and F-spondin2 (D). Embryos in A and B are 26 h. Embryos in C and D are 28 h. An arrowhead in (A) indicates the rostral end of mindin1 expression in the floor plate. It extends up to, but not including, the forebrain. The arrow in (A) indicates the rostral end of mindin1 expression in the hypochord. It extends up to the caudal end of the hindbrain. An arrowhead in (C) indicates F-spondin1 expression in the rhombomere 4. Arrows in (C) indicate F-spondin1-expressing cells in the forebrain. An arrow in (D) indicates F-spondin2-expressing cells in the forebrain. (E) Dorsal view of a 36-h embryo stained for F-spondin2 mRNA. (F) A close-up view of the boxed region in E. F-spondin2 is expressed in a cluster of cells (arrowhead) just behind the epiphysis. (G) Dorsal view of a 32- h embryo double-stained for F-spondin2 mRNA and for acetylated α-tubulin. F-spondin2-positive signal (arrowhead) is present just beneath the posterior commissure. (H and I) Cross section of the hindbrain region of 28-h embryos stained for mindin1 mRNA (H) and F-spondin2 mRNA (I). fp, floor plate; hy, hypochord; fb, forebrain; mb, midbrain; hb, hindbrain; e, epiphysis; pc, posterior commissure. Scale bar, 100 μm in A?D, 180 μm in E, 30 μm in F and G, and 17 μm in H and I. |
|
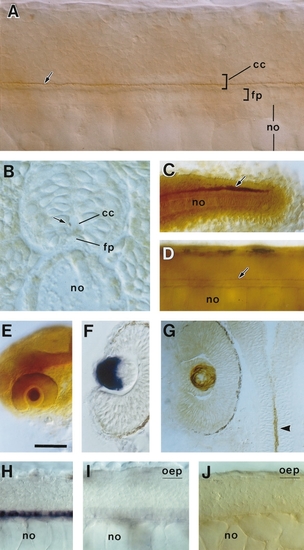
Expression of F-spondin2 protein. The anti-F-spondin2 antibody Ab-spo2-1 was used for staining. (A) Lateral view of a 26-h embryo. (B) Cross section of a 26-h embryo. (C) Tail region of a 26-h embryo. Lateral view. (D) Lateral view of a 36-h embryo. Arrows in (A?D) indicate F-spondin2 immunoreactivity in the putative Reissner?s fiber. (E) Head region of a 28-h embryo. Lateral view. The lens in the eye is specifically labeled. (F) Horizontal section of the eye of a 28-h embryo stained for F-spondin2 mRNA by in situ hybridization. Epithelial layer of the lens is labeled. (G) Horizontal section of the eye of a 28-h embryo stained with the anti-F-spondin2 antibody. In contrast to the pattern of mRNA expression, F-spondin2 immunoreactivity is located in the fiber layer of the lens. An arrowhead shows the signal in the central canal. (H and I) Lateral views of 28-h wild-type (H) and oep homozygous (I) embryos stained for F-spondin2 mRNA by in situ hybridization. In the oep mutant (I), expression of F-spondin2 in the midline cells of the spinal cord is extensively reduced. (J) Lateral view of a 28-h oep homozygous embryo stained with the anti-F-spondin2 antibody. The thread-like immunoreactivity is absent. cc, central canal; fp, floor plate; no, notochord. Scale bar, 25 μm in A; 15 μm in B; 50 μm in C, D, F, and G; 100 μm in E; and 37 μm in H?J. |
|
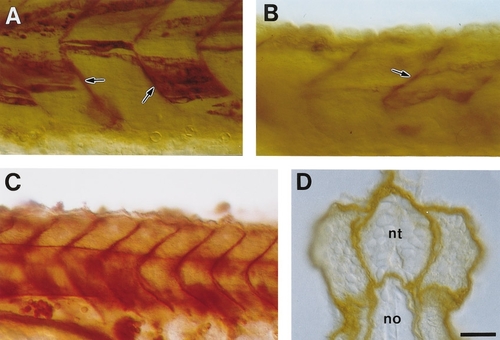
Localization of ectopically expressed Mindin1 protein. All embryos are at about 24 h of development. (A) Lateral view of the zα-actin? mindin1-myc-injected embryo stained with the anti-myc antibody. (B) Lateral view of the zα-actin?mindin1-injected embryo stained with one of the anti-Mindin1 antibodies (Ab-mdn1-6). The antibody may recognize Mindin2 (see Materials and Methods). However, the staining pattern was quite likely derived from ectopically expressed Mindin1 in muscle cells, since such staining was absent in uninjected embryos. Arrows in A and B indicate intense immunoreactivity in the basal lamina. (C) Lateral view of the sCMV?mindin1- myc-injected embryo stained with the anti-myc antibody. (D) Cross section of the sCMV?mindin1-myc-injected embryo stained with the anti-myc antibody. nt, neural tube; no, notochord. Scale bar, 27 μm in A and B, 40 μm in C, and 15 μm in D. |
Reprinted from Developmental Biology, 192, Higashijima, S., Nose, A., Eguchi, G., Hotta, Y., and Okamoto, H., Mindin/F-spondin family: novel ECM proteins expressed in the zebrafish embryonic axis, 211-227, Copyright (1997) with permission from Elsevier. Full text @ Dev. Biol.

