
- Title
-
Planar cell polarity zebrafish models of congenital scoliosis reveal novel underlying defects in notochord morphogenesis
- Authors
- Wang, M., Zhao, S., Shi, C., Guyot, M.C., Liao, M., Tauer, J.T., Willie, B.M., Cobetto, N., Aubin, C.?., K?ster-Sch?ck, E.D., Drapeau, P., Zhang, J., Wu, N., Kibar, Z.
- Source
- Full text @ Development
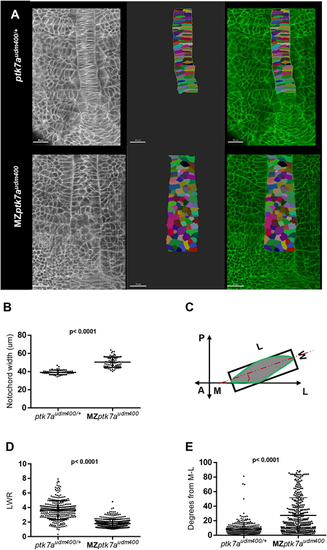
MZptk7audm400 mutants display defective convergent extension of notochord precursor cells. (A) Multiphoton image (left) of ptk7audm400/+ (top) and MZptk7audm400 embryos (bottom) at 14 hpf. Dorsal views of 2D renderings of notochord cells are shown in the middle panel and the overlap on the right. Vacuolated cells are colored artificially. Scale bars: 30 �m. (B) The notochord is significantly wider in MZptk7audm400 (n=12) compared with their ptk7audm400/+ siblings (n=9). P-value was calculated using two-tailed Welch's t-test. (C) A schematic of the method used to measure length-to-width ratio (LWR) and cell angle relative the mediolateral (ML) axis. A, anterior; P, posterior. (D,E) LWR is significantly lower (D) and the M-L orientation is significantly defective (E) in MZptk7audm400 (3 embryos, n=331) compared with their ptk7audm400/+ siblings (3 embryos, n=303). P-value was calculated using two-tailed Mann?Whitney U-test. |
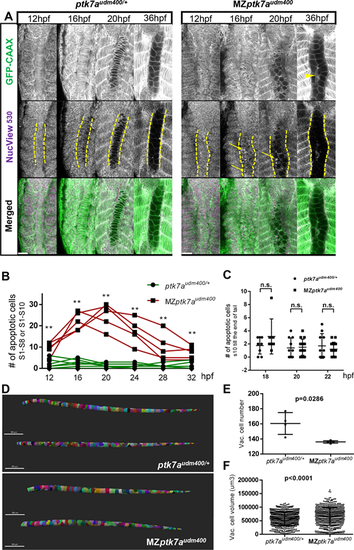
MZptk7audm400 mutants show more apoptotic cells prior to notochord vacuolation, leading to a significantly reduced cell number after the vacuolation process. (A) Representative multiphoton images from time-lapse recording of notochord cells from 12-14 hpf until 36 hpf in MZptk7audm400 (right) and their ptk7audm400/+ siblings (left). Various time points (12, 16, 20 and 36 hpf) with GFP staining (top), cell apoptosis staining (middle) and merged (bottom) are shown. Dashed lines mark the boundaries of the notochord. Arrows and arrowhead indicate apoptotic cells and cell debris, respectively. Scale bars: 40 �m. (B) The number of apoptotic cells is indicated at various time points during time-lapse imaging at the region from s1 to s8 or s10. This number is significantly larger in MZptk7audm400 embryos (n=7) compared with their ptk7audm400/+ siblings (n=5) at all stages analyzed. (C) The number of apoptotic cells at the region from s10 to the tail end at 18 hpf, 20 hpf and 22 hpf in MZptk7audm400 embryos (n=7, 14 and 14, respectively) is similar to that of their ptk7audm400/+ siblings (n=8, 10 and 10, respectively). (D) Lateral (top) and dorsal (bottom) views of notochord 3D reconstructions at 5 dpf. Scale bars: 300 �m. (E,F) The total number of vacuolated cells (E) is significantly reduced, and the volume of individual vacuolated cells (F) is significantly larger in MZptk7audm400 mutants (n=4) compared with their ptk7audm400/+ siblings (n=4) at 5 dpf. For B,C,E, P-values were calculated using two-tailed Mann?Whitney U-test. **P<0.01; n.s., not significant. For F, P-value was calculated using two-tailed Welch's t-test. |
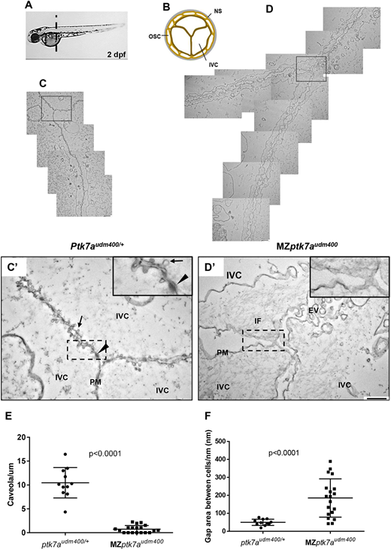
Transmission electron microscopy reveals ultrastructural abnormalities of the notochord vacuolated region in MZptk7audm400 mutants. (A) The level of the transverse cross-sections of 2 dpf embryos for TEM studies is shown. (B) A representative diagram of a transverse section of the notochord. (C-D?) Overlapping ultrastructure images of the junction between two neighboring inner vacuolated cells from MZptk7audm400 embryos (D) and their ptk7audm400/+ siblings (C). C? and D? show higher magnification views of the boxed regions in C and D, respectively. Arrow and arrowhead indicate caveolae and desmosome, respectively. MZptk7audm400 mutants show severely loosened inter-vacuolated cell junctions with an abnormal accumulation of IF and of extracellular vesicles as well a severe reduction in the number of caveolae with an altered morphology in the plasma membrane of the vacuolated cells. Insets show higher magnifications of the boxed areas. Scale bars: 800 nm (C,D); 400 nm (C?,D?). (E) Quantification of the ?normal? caveolae in MZptk7audm400 (3 embryos, 11 images) and their ptk7audm400/+ siblings (3 embryos, 19 images). (F) Quantification of the gap between adjacent vacuolated cells after membrane length standardization. P-values were calculated using two-tailed Mann?Whitney U-test. EV, extracellular vesicles; IF, intermediate filament; IVC, inner vacuolated cell; NS, notochord sheath; OSC, outer sheath cell; PM, plasma membrane. |

MZptk7audm400 mutants displayed delayed vertebrae mineralization, segmentation defects and a wavy notochord. (A,B) Representative lateral views of calcein staining images of MZptk7audm400 mutants and their control siblings at 7 dpf (A) and 15 dpf (B). Arrow points to the mineralization of vertebrae. (C) The number of mineralized vertebrae is significantly reduced in MZptk7audm400 mutants compared with their control siblings at 7 dpf (n=26 and 17, respectively; P<0.0001) and 15 dpf (n=13 and 25, respectively; P<0.001). (D) Examples of segmentation defects detected in MZptk7audm400 mutants upon calcein staining at 15 dpf, including wedged vertebrae (arrowhead), skipping of mineralization (bracket), V1-V2 fusion (arrow) and hemivertebrae (asterisks). (E) Representative lateral views of calcein staining images alone (top) or merged with brightfield images (bottom) of MZptk7audm400 mutants and their control siblings at 9 dpf (starved). Bracket indicates skipping of mineralization, and asterisks indicate aberrant mineralization initiation points. (F) Representative dorsal views of Alizarin Red staining alone (top) or merged with brightfield images (bottom) of MZptk7audm400 mutants and their control siblings at 15 dpf. The numbers of vertebrae and of myotomes are indicated in the upper and lower panels, respectively. Dashed line indicates the center of the vertebral axis. (G) Examples of severe bends and kinks detected in the anterior part of the spines of MZptk7audm400 mutants upon Alizarin Red staining (indicated by arrows). (H) Dorsal views of brightfield images of 2 dpf embryos focusing on the notochord. Dashed line indicates the boundaries of the notochord. Note the wavy morphology in the anterior part of the notochord in MZptk7audm400 mutants. P-values were calculated using two-tailed Welch's t-test. ***P<0.001, ****P<0.0001. Scale bars: 1 mm in A,B; 200 �m in D-H. |

MZptk7audm400 mutants display a severe 3D spinal curvature and CVMs restricted to the anterior part of the spine. (A,B) Representative ?CT images of ptk7audm400/+ (A) and MZptk7audm400 (B) 3 months postfertilization adult females (lateral views, top; dorsal views, bottom). MZptk7audm400 adults display severe 3D curvature defects. (C) Representative ?CT images of ptk7audm400/+ adult fish showing a lateral view of a normally segmented anterior part of the spine (dorsal view of V1-V4 is shown in the inset). (D) Representative ?CT images of MZptk7audm400 adult fish showing the most common CVM defect (fusion of V1 and V2) from lateral and dorsal view (inset). (E,F) Examples of lateral views of other severe CVMs detected in MZptk7audm400 adult fish, including fused V1-V4 (E) and mis-segmentation of V6-V8 (F). (G,H) Quantification of curve severity, direction, and position along dorsal-ventral (G) and left-right (H) axes. (I) Diagram of the CVMs detected in MZptk7audm400 (n=8) compared with ptk7audm400/+ (n=8). All CVMs were restricted to the anterior part of the spine spanning V1 to V9. CFV, caudal fin vertebrae; CV, caudal vertebrae; PV, precaudal vertebrae; WA, Weberian vertebrae. Scale bars: 2 mm. |
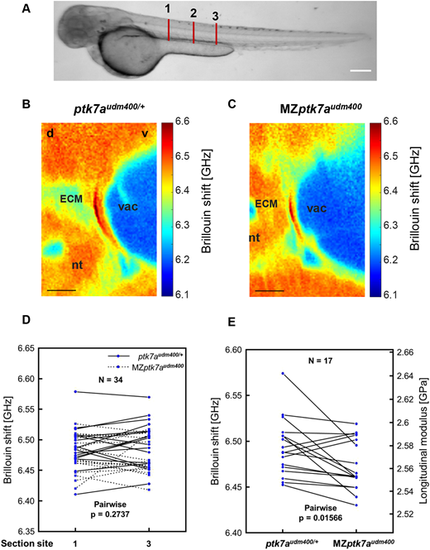
Notochord ECM in MZptk7audm400 mutants is less stiff. (A) Representative brightfield images of ptk7audm400/+ fish at 3 dpf. Red lines indicate the scanning section location. Section 1: level of somites 7, 8; Section 2: level of somites 10, 11; Section 3: level of somites 13, 14 (the end of yolk extension). (B,C) Representative images of cross-section Brillouin shift around the dorsal side of notochord in ptk7audm400/+ (B) and MZptk7audm400 (C) embryos at 3-4 dpf. d, dorsal; ECM, extracellular matrix; nt, neural tube; v, ventral; vac, vacuole. Scale bars: 10 �m. (D) Quantification of Brillouin shift in fish at 3-4 dpf shows no significant difference between anterior scanning section 1 and posterior scanning section 3 (shown in A). (E) Quantification of Brillouin shift and the corresponding longitudinal modulus of ECM shows a significant difference between ptk7audm400/+ and MZptk7audm400 embryos. P-values were calculated using two-tailed pairwise t-test. |

Loss of function of another PCP gene vangl2 leads to severe 3D curvature defect, anterior CVMs and increased notochord cell apoptosis. (A) Representative images of 2 dpf embryos injected with increasing doses of a morpholino (MO) targeting vangl2. WT, uninjected wild type. (B) The body length of vangl2 morphants is significantly reduced compared with non-injected fish at all three doses. Uninjected (WT), n=155; 0.5 ng, n=109; 1 ng, n=251; 2 ng, n=228. (C) ptk7a and ptk7audm400/+ embryos showed significant body length truncation following injection of low dose (0.5 ng) vangl2-MO. Uninjected ptk7a, n=49; uninjected ptk7audm400/+, n=37; MO-injected ptk7a, n=38; MO-injected ptk7audm400/+, n=48. (D) Lateral views of an uninjected WT fish and of a vangl2 morphant (0.5 ng MO) showing a scoliosis-like phenotype. (E) Calcein-stained images of WT and of vangl2 morphants (1 ng MO) at 22 dpf. Vangl2 morphants show a hemi vertebrae (asterisk) and fused V5-V6 vertebrae (arrow). Scale bars: 200 �m. (F) Representative �CT images of vangl2 morphants (0.5 ng) and of non-injected WT adult fish from lateral view and dorsal view (inset). Scale bars: 2 mm. (G) Reconstructed 3D structure with Imaris surface module from �CT scans (ventral and lateral views are shown in upper and lower panels, respectively). Dashed line indicates the separation between the first two vertebrae. V1 in vangl2 morphants displays a wedge vertebra. Scale bars: 300 �m. (H) Representative images of the notochords of uninjected WT fish and of vangl2 morphants (2 ng) stained with NucView530 Caspase-3 live staining at 19 hpf. Examples of apoptotic cells are indicated by arrows. Dashed lines delineate the notochord. Scale bars: 20 �m. (I) Quantification of apoptotic cells in the anterior part of the notochord from s1 to s6 or s8 at 19 hpf. The number of apoptotic cells is significantly increased in vangl2 morphants (2 ng MO; n=6) compared with uninjected WT embryos (n=6). (J) Representative multiphoton images of cell apoptosis staining of the anterior notochord of vangl2m209 mutants and their siblings at 19 hpf. Examples of apoptotic cells are indicated by arrows. Dashed lines delineate the notochord. Scale bars: 20 �m. (K) Quantification of apoptotic cells in the anterior part s1 to s6 or s10 of the notochord at 19 hpf in vangl2m209 embryos (n=6) and their vangl2m209/+ siblings (n=14). (L) Quantification of the apoptotic cells from s10 to the end of tail at 20 hpf between vangl2m209 mutants (n=11) and their vangl2+(n=2) and vangl2m209/+ (n=4) siblings. The number of apoptotic cells is significantly increased in vangl2m209 mutants compared with their siblings at anterior and posterior regions of the notochord. For B,C, P-values were calculated using two-tailed Welch's t-test. n.s., not significant. For I,K,L, P-values were calculated using two-tailed Mann?Whitney U-test. |
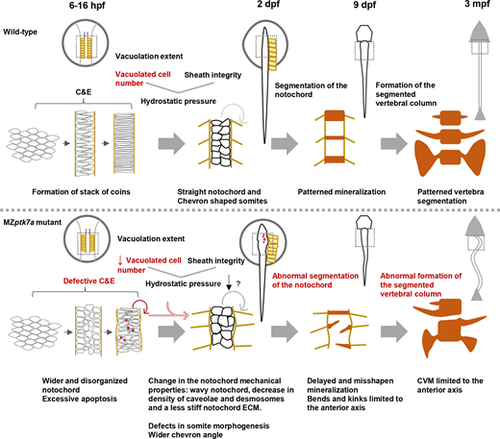
Proposed model for the pathogenic mechanism(s) underlying CVM in MZptk7a mutants. In wild-type zebrafish embryos, starting from the shield stage (?6 hpf), mesodermal cells undergo C&E to form a typical stack of coin-like notochord in the dorsal midline just before the beginning of the vacuolation process (?16 hpf). As notochord cells vacuolate, they are resisted by the notochord sheath, thereby increasing the notochord internal pressure and stiffness, and enabling the notochord to elongate and straighten. At later stages, the notochord provides a scaffold for the patterned spine segmentation. In MZptk7a mutants, a defective C&E leads to a wider and disorganized notochord that would lead to excessive apoptosis around the initiation time of the vacuolation process and a decrease in the number of vacuolated cells. This would cause a decrease in the notochord pressure and a change in the mechanical properties of the notochord, as manifested by a wavy notochord, a decrease in the density of caveolae and desmosomes, and a less stiff notochord ECM. These cellular and mechanical changes would, in turn, lead to notochord kinks, spine mis-segmentation and CVMs limited to the anterior axis. Notochord defects in MZptk7a mutants were accompanied by a wider chevron angle and defects in somite development. C&E, convergence and extension; mpf, months postfertilization |