
|
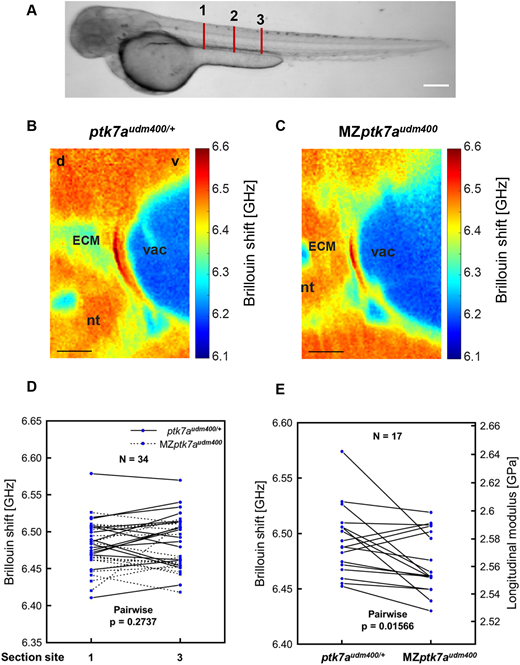
Fig. 6 Notochord ECM in MZptk7audm400 mutants is less stiff. (A) Representative brightfield images of ptk7audm400/+ fish at 3 dpf. Red lines indicate the scanning section location. Section 1: level of somites 7, 8; Section 2: level of somites 10, 11; Section 3: level of somites 13, 14 (the end of yolk extension). (B,C) Representative images of cross-section Brillouin shift around the dorsal side of notochord in ptk7audm400/+ (B) and MZptk7audm400 (C) embryos at 3-4 dpf. d, dorsal; ECM, extracellular matrix; nt, neural tube; v, ventral; vac, vacuole. Scale bars: 10 �m. (D) Quantification of Brillouin shift in fish at 3-4 dpf shows no significant difference between anterior scanning section 1 and posterior scanning section 3 (shown in A). (E) Quantification of Brillouin shift and the corresponding longitudinal modulus of ECM shows a significant difference between ptk7audm400/+ and MZptk7audm400 embryos. P-values were calculated using two-tailed pairwise t-test.