FIGURE SUMMARY
Title

RFC2 may contribute to the pathogenicity of Williams syndrome revealed in a zebrafish model

Authors
Park, J.W., Choi, T.I., Kim, T.Y., Lee, Y.R., Don, D.W., George-Abraham, J.K., Robak, L.A., Trandafir, C.C., Liu, P., Rosenfeld, J.A., Kim, T.H., Petit, F., Kim, Y.M., Cheon, C.K., Lee, Y., Kim, C.H.
Source
Full text @ J. Genet. Genomics

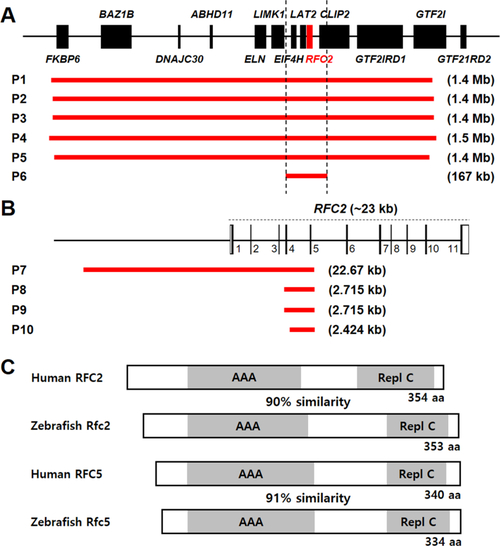
WS patients with 7q11.23 microdeletions and
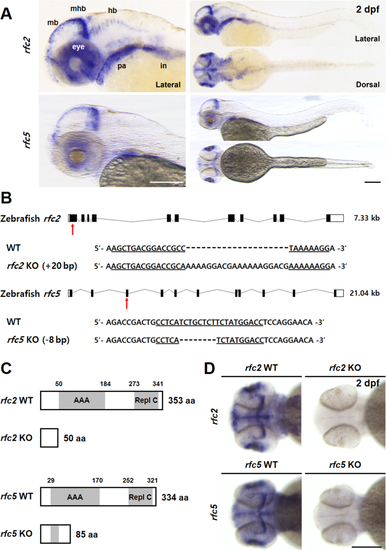
 RFC2 intragenic deletions. A: Five WS patients (P1–P5) with typical 7q11.23 microdeletions. Chromosomal microarray test detected 1.4 Mb–1.5 Mb microdeletions including RFC2. We also identified one patient (P6) with a smaller 167 kb deletion, comprising RFC2 but not ELN. B: Patients (P7–P10) with RFC2 intragenic microdeletions. RFC2 consists of 11 exons (1–11), spanning ∼23 kb. C: Comparison of human RFC2 (NP_852136.1) with zebrafish Rfc2 (NP_001013344.2) and human RFC5 (NP_031396.1) with zebrafish Rfc5 (NP_001003862.1). All four have an AAA domain and a Repl C domain in common. The zebrafish rfc2 encodes 353-aa protein, with a high level of similarity (90%) to the human RFC2 protein and the zebrafish rfc5 encodes 334-aa protein, with a high level of similarity (91%) to the human RFC5 protein. aa, amino-acid; Repl C, Replication factor C C-terminal domain; AAA, AAA+ ATPase domain.

Generation of rfc2 KO and rfc5 KO zebrafish using CRISPR-Cas9. A: Expression of rfc2 or rfc5 mRNAs in zebrafish embryos at 2 dpf. Lateral and dorsal view, anterior is to the left. Both genes are expressed in mb, mhb, hb, and eyes. B: Schematic gene structure of zebrafish rfc2 and rfc5 with KO target sites (arrows), exon 1 of rfc2 and exon 3 of rfc5. Indel mutations include 20-bp insertion (+22 bp, −2 bp) in rfc2 (named rfc2ck179a) and 8-bp deletion in rfc5 (named rfc5ck171a). C: Predicted protein structure of each KO mutation, resulting in truncated proteins caused by frameshift. D: Loss of rfc2 or rfc5 mRNA expression in each KO zebrafish at 2 dpf. Dorsal view. n = 12 for rfc2 WT, n = 17 for rfc2 KO, n = 12 for rfc5 WT, and n = 9 for rfc5 KO. Scale bar, 200 μm (A and D). mb, midbrain; mhb, midbrain-hindbrain boundary; hb, hindbrain; WT, wild-type; KO, knockout; dpf, days post fertilization; AAA, AAA+ ATPase domain; Repl C, Replication factor C C-terminal domain; pa, pharyngeal arches; in, intestine.

Reduced head and brain size in
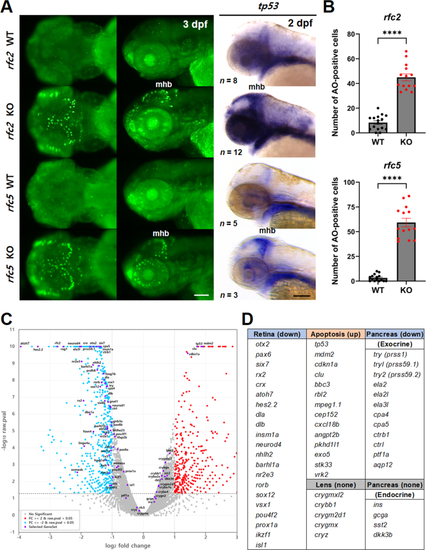
 rfc2 KO and rfc5 KO zebrafish. A: Reduced head size in KO zebrafish is prominent at 5 dpf, whereas relatively comparable at 2 dpf. Eye size is also reduced in both KO zebrafish, compared to WT zebrafish at 5 dpf. n = 5 for rfc2 KO and n = 4 for rfc5 KO at 2 dpf. n = 13 for rfc2 KO and n = 25 for rfc5 KO at 5 dpf. Lateral view. B: Quantification of eye size in rfc2 KO and rfc5 KO zebrafish. The planar area of eye was measured by Image J software at 3 dpf and 5 dpf, respectively. C: Reduced brain size in rfc2 KO zebrafish at 5 dpf. Dorsal view. D: Quantification of reduced brain size (bordered area in C) in rfc2 KO zebrafish at 5 dpf. n = 18 for WT and n = 31 for KO. E: Representative fluorescent image of rfc5 KO zebrafish crossed with neuron-specific GFP transgenic line Tg(huc:egfp) at 5 dpf. Dorsal view, anterior is to the left. F: Quantification of brain size in rfc5 KO at 5 dpf. Relative brain size was obtained by multiplying the length of (a) and (b) marked in the brain image of (E). n = 7 for WT and n = 34 for KO. Data are presented as mean ± SEM. Statistical significance was determined by the Kruskal–Wallis tests with post-hoc Dunn's multiple comparisons tests. ns, not significant, P > 0.05; ∗, P < 0.05; ∗∗, P < 0.01; ∗∗∗, P < 0.001; ∗∗∗∗, P < 0.0001. Scale bar, 100 μm (A, C, E). dpf, days post fertilization; WT, wild-type; KO, knockout; SEM, standard error of the mean.

Increased cell death in rfc2 KO and rfc5 KO zebrafish. A: Detection of cell death by AO staining in KO zebrafish at 3 dpf. Apoptotic cells were mainly detected in midbrain, mhb, and retina. Earlier apoptotic cells were confirmed by the apoptosis marker tp53 expression at 2 dpf. Left panels are dorsal view, middle and right panels are lateral view, anterior is to the left. B: Quantification of AO-positive cells within the brain region in rfc2 KO or rfc5 KO zebrafish. n = 16 for rfc2 WT, n = 14 for rfc2 KO, n = 15 for rfc5 WT, and n = 14 for rfc5 KO. Data are presented as mean ± SEM. Statistical significance was determined by the unpaired two-tailed t-tests with Welch's correction. ∗∗∗∗, P < 0.0001. C: Visualization of RNA-seq analysis with volcano plot. Blue dots represent down-regulated, red dots for up-regulated, gray dots for not significantly changed, and purple dots for labeled genes in rfc2 KO, compared to WT. D: List of representative gene sets involved in eye development or pancreas function. Scale bar, 100 μm (A). AO, acridine orange; mhb, midbrain-hindbrain boundary; WT, wild-type; KO, knockout; SEM, standard error of the mean.

Skeletal and vascular phenotypes in rfc2 KO and rfc5 KO zebrafish. A: Defects in head cartilage formation in KO zebrafish at 5 dpf. Alcian blue staining, ventral view, anterior is to the left. B: Quantification of cartilage structures in rfc2 KO zebrafish. n = 14 for WT and n = 18 for KO. C: Defects in bone structures in KO zebrafish. Alizarin red S staining at 9 dpf. Lower panels are magnifications of upper panels, showing defects in bone and teeth development (arrows). n = 8 for rfc2 WT, n = 25 for rfc2 KO, n = 10 for rfc5 WT, and n = 23 for rfc5 KO. Ventral view, anterior is to the left. D: Vascular defects in KO zebrafish crossed with Tg(kdrl:gfp) at 7 dpf. Aortic arches are indicated by arrows. n = 9 for rfc2 WT, n = 27 for rfc2 KO, n = 14 for rfc5 WT, and n = 18 for rfc5 KO. Ventral view, anterior is to the left. E: Lateral view of aortic arches. Blood vessels were narrowed and hypo-branched in rfc2 KO, compared to WT and Het. F: Quantification of vessel diameter of the most posterior aortic arch (arrow in E) was measured using Image J software. n = 9 for WT, n = 18 for Het, and n = 9 for KO. Data are presented as mean ± SEM. Statistical significance was determined by the Kruskal–Wallis tests with post-hoc Dunn's multiple comparisons tests. ns, not significant, P > 0.05; ∗∗, P < 0.01; ∗∗∗, P < 0.001; ∗∗∗∗, P < 0.0001. Scale bar, 100 μm (A, C, D, E). dpf, days post fertilization; AW, articulation width; PL, Palatoquadrate length; M, Meckel's cartilage; m, maxilla; o, opercle; en, entopterygoid; br, branchiostegal ray 1; cb, ceratobranchial 5; WT, wild-type; KO, knockout; Het, heterozygous; SEM, standard error of the mean.

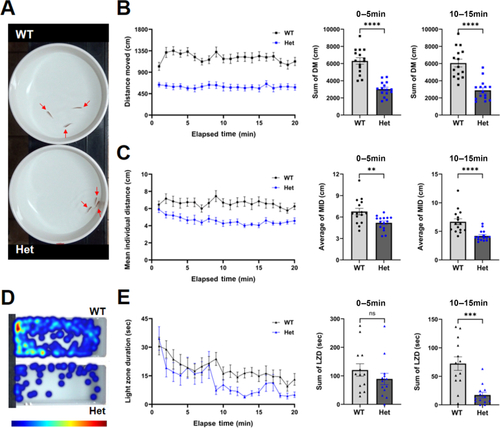
Increased social cohesion and anxiety-like behavior in Het adult rfc2 KO zebrafish. A: Representative image of the shoaling bowl assay. Each arrow indicates a single zebrafish. B: Quantification of DM of zebrafish during shoaling bowl assay. Compared to WT siblings, rfc2 KO Het zebrafish showed a significant reduction in their movement during the test. n = 5 for WT and n = 9 for Het fish in 15 times of tests. C: Quantification of MID between three subjects. Compared to WT siblings, rfc2 KO Het tend to stay closer each other. D: Heatmap of scototaxis test. The red color indicates increased dwell time and blue indicates decreased. E: Quantification of duration time in the light zone during scototaxis test. Compared to WT siblings, rfc2 KO Het zebrafish stayed more time in the dark zone than the light zone. n = 5 for WT and n = 9 for Het fish in total 13 times of tests. Data are presented as mean ± SEM. Statistical significance was determined by the Mann Whitney U test. ns, not significant, P > 0.05; ∗∗, P < 0.01; ∗∗∗, P < 0.001; ∗∗∗∗, P < 0.0001. MID, mean individual distance; Het, heterozygous; DM, distance moved; LZD, light zone duration; WT, wild-type; KO, knockout; Het, heterozygous; SEM, standard error of the mean.

Unillustrated author statements

Acknowledgments
This image is the copyrighted work of the attributed author or publisher, and ZFIN has permission only to display this image to its users. Additional permissions should be obtained from the applicable author or publisher of the image.

Reprinted from Journal of genetics and genomics = Yi chuan xue bao, 51(12), Park, J.W., Choi, T.I., Kim, T.Y., Lee, Y.R., Don, D.W., George-Abraham, J.K., Robak, L.A., Trandafir, C.C., Liu, P., Rosenfeld, J.A., Kim, T.H., Petit, F., Kim, Y.M., Cheon, C.K., Lee, Y., Kim, C.H., RFC2 may contribute to the pathogenicity of Williams syndrome revealed in a zebrafish model, 1389-1403, Copyright (2024) with permission from Elsevier. Full text @ J. Genet. Genomics