
- Title
-
Cilia defects upon loss of WDR4 are linked to proteasomal hyperactivity and ubiquitin shortage
- Authors
- Burkhalter, M.D., Stiff, T., Maerz, L.D., Casar Tena, T., Wiese, H., Gerhards, J., Sailer, S.A., Vu, L.A.T., Duong Phu, M., Donow, C., Alupei, M., Iben, S., Groth, M., Wiese, S., Church, J.A., Jeggo, P.A., Philipp, M.
- Source
- Full text @ Cell Death Dis.
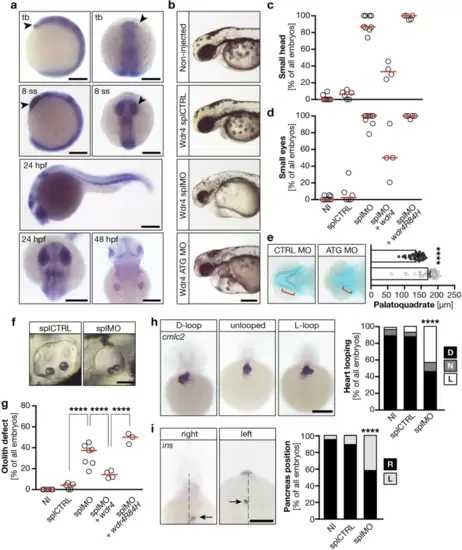
Wdr4 is expressed in and required for the developing brain.a Whole mount in situ hybridization (WMISH) revealed expression of wdr4 in anterior structures of the zebrafish embryo (arrow heads) including the developing brain. Tb tailbud stage; 8 ss 8 somite stage; hpf hours post fertilization. Scale bars: 200 �m. b Live images of 48 hpf zebrafish embryos, which were either non-injected (NI) or injected with one of the following MOs: splCTRL, splMO or a MO blocking translation of Wdr4 (Wdr4 ATG MO). Scale bar: 250 �m. c Scatter plot showing the incidence of microcephaly in zebrafish upon Wdr4 KD. Co-injection of capped RNA encoding zebrafish Wdr4 rescues head size, while the patient-resembling Wdr4 R84H does not. n = 3?9 experiments with 93?244 embryos in total. d Loss of Wdr4 results in zebrafish embryos with smaller eyes, which cannot be fully rescued by wdr4 R84H injection. n = 3?9 experiments with 93?244 embryos in total. e Reduced size of cartilage structures in the developing head as shown by Alcian blue staining. Graph shows measurement of the palatoquadrate (red bracket). Lower bar shows control. n = 16/15; ****p < 0.0001, Mann?Whitney test. f Images of the otoliths in the otic vesicle upon injection of splCTRL or Wdr4 splMO. Scale bar: 10 �m. g Knockdown of Wdr4 increases the percentage of embryos with fused otoliths. n = 3?9 experiments with 93?244 embryos in total. ****p < 0.0001. One-way ANOVA with Sidak?s multiple comparison test. h Loss of Wdr4 randomizes heart looping in 48 hpf zebrafish embryos. D, correct D-loop; N, no loop; L, inverse loop. n = 4 experiments with 63?94 embryos. ****p < 0.0001. Fisher?s exact test. Scale bar: 200 �m. i Pancreas placement is randomized upon Wdr4 KD. R, pancreas right from the midline (dotted line); L, pancreas left from midline. Arrows indicate insulin n = 4 experiments with 63?94 embryos in total. ****p < 0.0001. Fisher?s exact test. Scale bar: 200 �m. Red lines: median. |
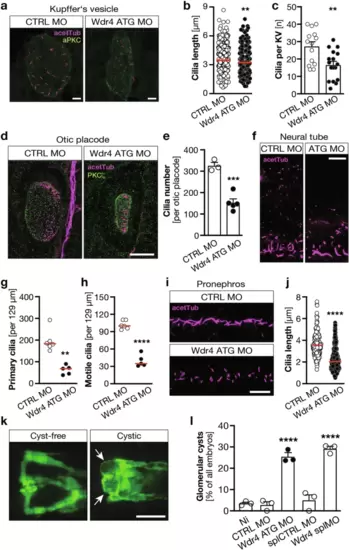
Lack of Wdr4 affects cilia in multiple organs in zebrafish.a Representative images of cilia in the Kupffer?s vesicle (KV) of 8 ss zebrafish embryos. Cilia in magenta (acetylated tubulin), green counterstain (PKCz) to visualize the KV outline. Scale bar: 10 �m. b KV cilia are shorter in the absence of Wdr4. n = 2 experiments with 14?17 KVs and 283?379 cilia in total. **p = 0.0066. Mann?Whitney test. c Zebrafish embryos depleted of Wdr4 extend fewer cilia into the KV. n = 2 experiments with 14?17 KVs in total. **p = 0.0034. Welch?s t test. Mean � SEM. d Loss of Wdr4 reduces cilia in the otic placode. Staining as in (a). Scale bar: 25 �m. e Quantification of otic placode cilia in 3 and 5 embryos injected with CTRL MO or Wdr4 ATG MO, respectively. ***p = 0.0003, Welch?s t test. Mean SEM. Scale bar: 10 �m. f Visualization of cilia in the neural tube by detection of acetylated tubulin (magenta). Shown are typical sections of CTRL MO or WDR4 ATG morphants. Scale bar: 10 �m. Wdr4 KD reduces primary (g) and motile (h) cilia. g n = 6/5, **p = 0.0043, Mann?Whitney test; h n = 6/5, ****p < 0.0001, Welch?s t test. i Wdr4 KD affects cilia in the pronephros. Staining as in (a). Scale bar: 10 �m. j Pronephric cilia are shortened upon loss of Wdr4. n = 6 with 170 and 193 cilia, ****p < 0.0001, Mann?Whitney test. k Induction of glomerular cysts upon loss of Wdr4. Pictures show cyst-free and cystic (arrows) glomeruli using the tg(wt1b:eGFP) reporter line. Scale bar: 100 �m. l Quantification of glomerular cyst formation after injection of two different MOs. n = 3 with 69?115 embryos; CTRL MO vs. Wdr4 ATG MO ****p < 0.0001; splCTRL MO vs. Wdr4 splMO ****p < 0.0001. One-way ANOVA with Sidak correction. Red line: median. |
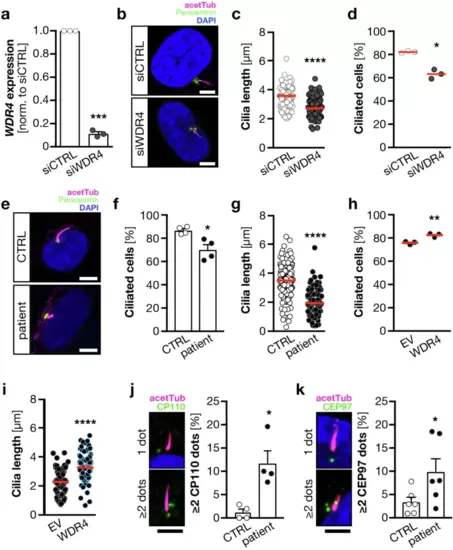
Cilia defects in the absence of WDR4 in human fibroblasts.a siRNA transfection of human fibroblasts results in reduced WDR4 expression. qPCR normalized to housekeeping gene (SDHA) and to siCTRL transfected cells. n = 3. ***p = 0.0003, paired t-test. b Immunofluorescence of cilia in fibroblasts transfected with control or WDR4 siRNA. Magenta: acetylated tubulin (cilia); green: pericentrin (PCNT, centrioles). Scale bar: 5 �m. c Cilia are shorter upon WDR4 KD. n = 3 experiments with 95?99 cilia in total. ****p = 0.0001. Welch?s t test. d WDR4 KD cells have fewer cilia. n = 3 experiments. *p = 0.0108. Unpaired, Welch?s t test. e Immunofluorescence of control and patient-derived primary fibroblasts. Staining as in (a). Scale bar: 5 �m. f Wdr4 patient fibroblasts have fewer cilia. n = 4 experiments. *p = 0.0255. Welch?s t test. g WDR4 patient fibroblasts have shorter cilia. n = 4 experiments with 108?174 cilia in total. ****p < 0.0001. Mann?Whitney test. h Nucleofection of WDR4 patient fibroblasts with a plasmid encoding human WDR4 rescues the percentage of ciliated cells. n = 3 experiments. **p = 0.01. Welch?s t test. i Reconstitution with WDR4 restores cilium length in patient fibroblasts. n = 3 experiments with 99 and 100 cilia. ****p < 0.0001. Welch?s t test. j Wdr4 patient cells show increased frequency of aberrant CP110 staining (green). n = 4 experiments with 407 and 411 cells in total. *p = 0.0455. Paired t-test. Mean + SEM. Scale bar: 3 �m. k Wdr4 patient cells show increased frequency of aberrant CEP97 staining (green). n = 6 experiments with 625 and 617 cells in total. *p = 0.0342. Paired t-test. Mean + SEM. Scale bar: 3 �m. Red line indicates median. |
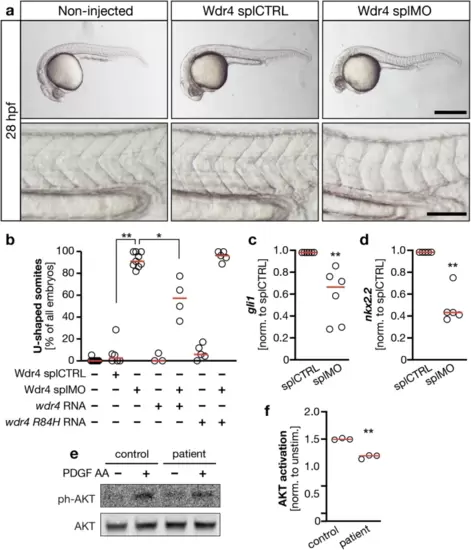
Loss of WDR4 dampens ciliary signaling capacity.a Embryos were left non-injected or were injected with either splCTRL MO or Wdr4 splMO and scored for U-shaped somites at the age of 28 hpf as a read-out for Hedgehog signaling. Only embryos injected with Wdr4 splMO show this defect. Lower panels show same embryos with higher magnification. Scale bars: upper panels 500 �m, lower panels 100 �m. b Co-injection of wdr4 RNA partially rescues induction of U-shaped somites upon loss of Wdr4. n = 3?10 experiments with 103?189 embryos. splCTRL vs. splMO **p = 0.0033; splMO vs. splMO + wdr4 RNA *p = 0.015; Kruskal?Wallis test with Dunn?s post-test. c Expression of gli1 in injected zebrafish embryos. Normalized to gapdh and splCTRL. n = 6; **p = 0.0022. Mann?Whitney test. d Expression of nkx2.2 in injected zebrafish embryos. Normalized to gapdh and splCTRL. n = 6; **p = 0.0079. Mann?Whitney test. e WDR4 patient cells show lower capacity for AKT activation upon stimulation with PDGF AA. f Quantification of AKT activation upon stimulation with PDGF AA. Signals were normalized to unphosphorylated AKT and nonstimulated. n = 3; **p = 0.0012. Welch?s t test. Red line: median. |
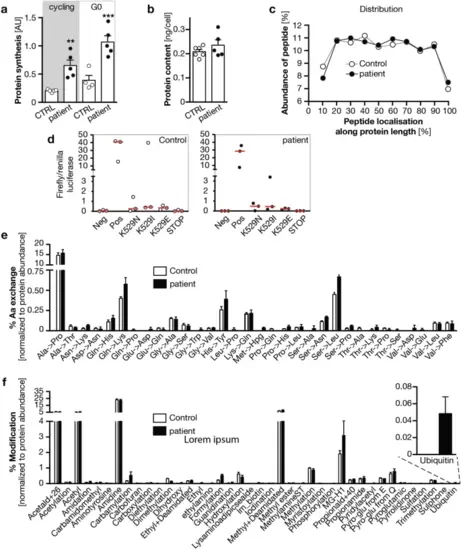
WDR4 patient fibroblasts are not deficient in protein synthesis.a Nascent protein synthesis is increased in WDR4 patient fibroblasts under cycling and resting conditions. n = 4?5. p = 0.0038 (**) and 0.0002 (***). Welch?s t test. b Overall protein content is not changed in WDR4 patient fibroblasts. n = 5?6. Mann?Whitney test. c WDR4 patient cells do not have more premature abortions during protein synthesis. Bar graph shows the distribution of peptides detected by mass spectrometry along the whole length of the protein. n = 2. d Assessment of translation fidelity in control and WDR4 patient fibroblasts using a luciferase based assay. Cells were transfected with firefly luciferase reporter constructs including the indicated mutations in the active center of the luciferase. Elevated luciferase activity indicates erroneous translation and reduced translational fidelity. Firefly luciferase activity was normalized to co-transfected renilla luciferase activity. e Bar graph showing amino acid exchange rates in control and WDR4 patient fibroblasts. n = 2. f Bar graph depicting posttranslational modifications in control and WDR4 patient fibroblasts. Inset shows ubiquitination modification. n = 2. |

WDR4 patient fibroblasts display increased proteasomal activity.a Proteasome activity is increased in WDR4 patient fibroblasts compared to control cells. Specificity of the assay is shown by complete signal abrogation by treatment with the proteasome inhibitor MG-132 (25 �M). n = 3 experiments. **p < 0.01. One-way ANOVA with Sidak?s post-test. b WDR4 patient cells display higher ubiquitination. Western blot for ubiquitin and GAPDH as loading control. **p = 0.0079. Mann?Whitney test. c Proteasome inhibition rescues cilia length in WDR4 patient fibroblasts. n = 3 experiments with 91?98 cilia in total. ****p < 0.0001. Mann?Whitney test. d Proteasome inhibition partially rescues the microcephaly in zebrafish embryos at 48 hpf. n = 4 experiments with 76?116 embryos in total. *p < 0.05, ****p < 0.0001. One-way ANOVA with Sidak?s post-test. e Treatment with a proteasome inhibitor also rescues the small eye phenotype in 48 hpf zebrafish. n = 4 experiments with 76?116 embryos in total. *p < 0.05, ****p < 0.0001. One-way ANOVA with Sidak?s post-test. f Wdr4 KD reduces the number of neuronal cells (Elavl3 + 4, green) in the neural tube of 24 hpf zebrafish, which can be rescued by proteasomal inhibition. Counterstaining for acetylated tubulin (magenta). n = 3 experiments with 45 embryos in each condition. ****p < 0.0001, Kruskal?Wallis test with Dunn?s post-test. Scale bar: 50 �m. g Simultaneous knockdown of HSPA1A partially rescues ciliation defect in human fibroblasts. n = 3, siCTRL1/siCTRL2 vs. siWDR4/siCTRL2 ***p = 0.0004; siWDR4/siCTRL2 vs. siHSPA1A/siCTRL2 ***p = 0.0007; siWDR4/siCTRL2 vs. siWDR4/siHSPA1A *p = 0.0255. One-way ANOVA with Sidak correction. h Simultaneous knockdown of HSPA1A rescues cilia length in human fibroblasts. n = 3, 96?104 cilia, siCTRL1/siCTRL2 vs. siWDR4/siCTRL2 ****p < 0.0001; siWDR4/siCTRL2 vs. siHSPA1A/siCTRL2 *p = 0.0119; siWDR4/siCTRL2 vs. siWDR4/siHSPA1A ****p < 0.0001; Kruskal?Wallis test with Dunn?s post-test. i The HSPA1A inhibitor pifithrin-� restores cilium length in WDR4 patient cells. Fibroblasts were treated with 5 �M pifithrin-� during the whole time of serum starvation. n = 3 with 103 (CTRL) and 112 (pifithrin-�) cilia in total. ****p < 0.0001. Two-tailed Welch?s test. j qPCR analyses shows reduced expression of ubiquitin precursors in serum-starved patient fibroblasts. *p = 0.0156 (UBA52, UBB, UBC) and 0.0312 (UBA80). Wilcoxon tests. k Ciliation rate can be rescued in patient cells nucleofected with a ubiquitin plasmid. n = 3 experiments. Per experiment at least 100 cells were counted. *p = 0.0246. Paired t-test. l Cilium length in WDR4 patient fibroblasts can be rescued by nucleofection of a ubiquitin plasmid; n = 3 with 105 cilia each, ****p < 0.0001. Welch?s t test. m Cilium length in WDR4 patient fibroblasts can be rescued by inhibition of ubiquitin activating enzymes with 5 nM TAK-243; n = 3 with 96 and 99 cilia. **p < 0.0062. Mann?Whitney test. Red line: median. |