
|
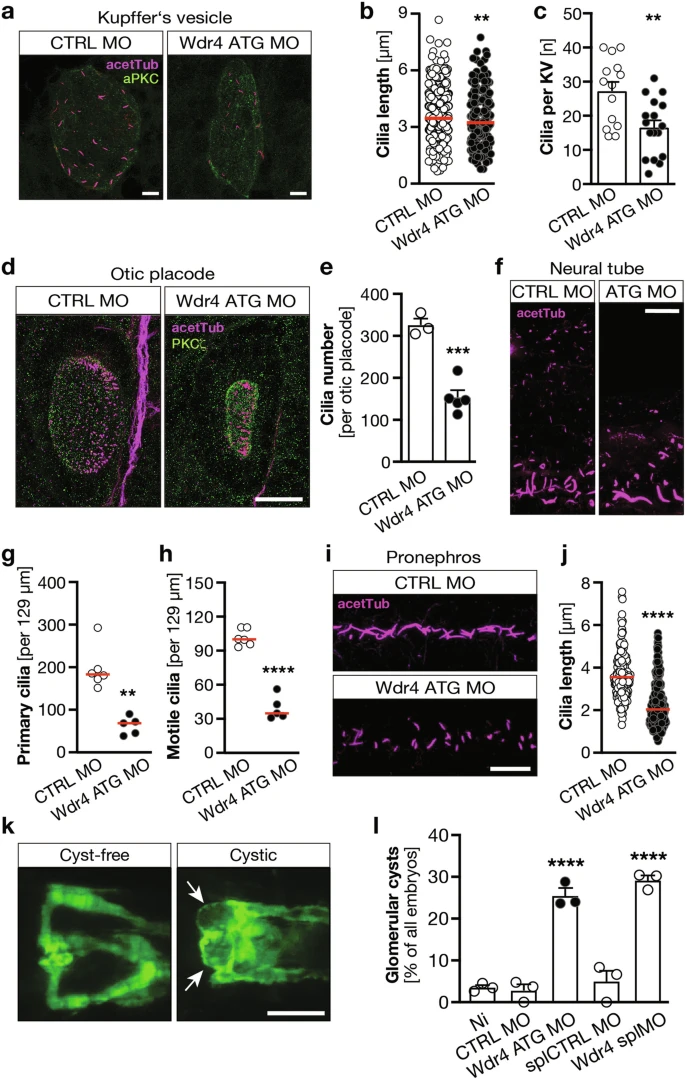
Fig. 2 Lack of Wdr4 affects cilia in multiple organs in zebrafish.a Representative images of cilia in the Kupffer?s vesicle (KV) of 8 ss zebrafish embryos. Cilia in magenta (acetylated tubulin), green counterstain (PKCz) to visualize the KV outline. Scale bar: 10 �m. b KV cilia are shorter in the absence of Wdr4. n = 2 experiments with 14?17 KVs and 283?379 cilia in total. **p = 0.0066. Mann?Whitney test. c Zebrafish embryos depleted of Wdr4 extend fewer cilia into the KV. n = 2 experiments with 14?17 KVs in total. **p = 0.0034. Welch?s t test. Mean � SEM. d Loss of Wdr4 reduces cilia in the otic placode. Staining as in (a). Scale bar: 25 �m. e Quantification of otic placode cilia in 3 and 5 embryos injected with CTRL MO or Wdr4 ATG MO, respectively. ***p = 0.0003, Welch?s t test. Mean SEM. Scale bar: 10 �m. f Visualization of cilia in the neural tube by detection of acetylated tubulin (magenta). Shown are typical sections of CTRL MO or WDR4 ATG morphants. Scale bar: 10 �m. Wdr4 KD reduces primary (g) and motile (h) cilia. g n = 6/5, **p = 0.0043, Mann?Whitney test; h n = 6/5, ****p < 0.0001, Welch?s t test. i Wdr4 KD affects cilia in the pronephros. Staining as in (a). Scale bar: 10 �m. j Pronephric cilia are shortened upon loss of Wdr4. n = 6 with 170 and 193 cilia, ****p < 0.0001, Mann?Whitney test. k Induction of glomerular cysts upon loss of Wdr4. Pictures show cyst-free and cystic (arrows) glomeruli using the tg(wt1b:eGFP) reporter line. Scale bar: 100 �m. l Quantification of glomerular cyst formation after injection of two different MOs. n = 3 with 69?115 embryos; CTRL MO vs. Wdr4 ATG MO ****p < 0.0001; splCTRL MO vs. Wdr4 splMO ****p < 0.0001. One-way ANOVA with Sidak correction. Red line: median.