FIGURE SUMMARY
Title

Cachd1 interacts with Wnt receptors and regulates neuronal asymmetry in the zebrafish brain

Authors
Powell, G.T., Faro, A., Zhao, Y., Stickney, H., Novellasdemunt, L., Henriques, P., Gestri, G., Redhouse White, E., Ren, J., Lu, W., Young, R.M., Hawkins, T.A., Cavodeassi, F., Schwarz, Q., Dreosti, E., Raible, D.W., Li, V.S.W., Wright, G.J., Jones, E.Y., Wilson, S.W.
Source
Full text @ Science

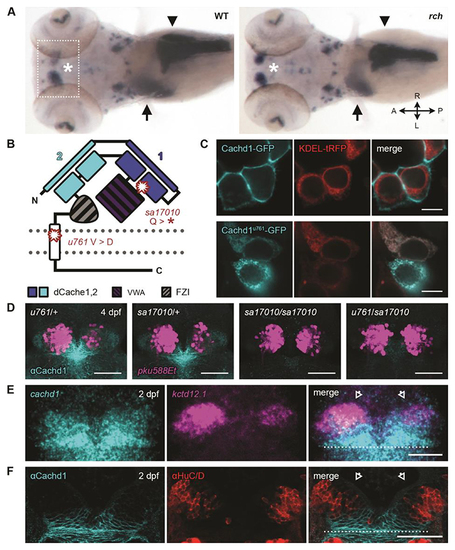
cachd1 mutants show bilaterally symmetrical, double-left habenulae.

(A) Dorsal views of whole-mount 5 dpf wild-type sibling and rorschach (rch/u761) mutant larvae showing expression of an asymmetric habenular marker (kctd12.1, indicated with asterisk; box indicates approximate epithalamic region) and markers for liver (selenop2, indicated with arrow), pancreas (prss1, indicated with arrowhead), and ventral retina (aldh1a3). (B) Schematic of Cachd1 protein: two dCache domains (cyan and dark blue), a VWA domain (purple stripes), a FZD interaction domain (FZI; gray stripes), a transmembrane domain (white), and an unstructured cytoplasmic tail. Residues affected in sa17010 and u761 alleles are marked in red at approximate positions in primary sequence. (C) Fluorescence images of transfected HEK293T cells expressing constructs encoding EGFP-tagged wild-type (top; cyan) or rch/u761 mutant Cachd1 (bottom; cyan) and KDEL-tRFP (red) to mark the endoplasmic reticulum. Scale bar, 10 μm. (D) Dorsal views of brains of dissected 4 dpf transgenic siblings from a complementation cross of sa17010 and u761 alleles, stained with antibody to Cachd1 (cyan). The Et(gata2a:EGFP)pku588 (pku588Et) transgene is expressed in dHbL neurons (magenta). (E) Dorsal view of 2 dpf habenulae after double fluorescent in situ hybridization with cachd1 antisense riboprobe (cyan) and the dHbL marker kctd12.1 (magenta). (F) Dorsal views of 2 dpf habenulae after immunohistochemistry with antibody to Cachd1 (cyan) co-stained with antibody to HuC/D to mark differentiating neurons (red). The dotted lines in (E) and (F) indicate the approximate position of the posterior commissure; open arrowheads indicate the dorsal habenulae. Shown are maximum projections of [(D) and (E)] confocal z-stacks or (F) single confocal slice. Scale bars, 50 μm.

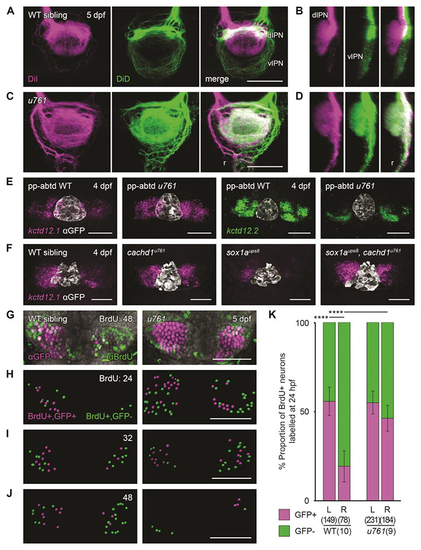
Loss of function of cachd1 disrupts habenular efferent connectivity, is epistatic to removal of the parapineal signal, and causes precocious neurogenesis.

(A and C) Dorsal views and (B and D) sagittal projections (dorsal left) of the IPN showing DiI (magenta) and DiD (green) labelling of left- and right-sided habenula neuron axon terminals predominantly innervating the dIPN and vIPN respectively, and raphe (r), in 5 dpf wild-type [(A) and (B), n = 3] or cachd1u761 mutant [(C) and (D), n = 8] larvae. (E) Dorsal views of 4 dpf wild-type or cachd1u761 mutant epithalami in which the parapineal was ablated before leftward migration (pineal complex marked by zf104Tg, u711Tg alleles with antibody to GFP; white) after double FISH with kctd12.1 (magenta; n = 26 of 29 wild-type siblings, 11 of 12 cachd1u761 mutants) or kctd12.2 (green; n = 19 of 23 wild-type siblings, 5 of 5 cachd1u761 mutants). (F) Dorsal views of 4 dpf larvae from a cross of carriers of cachd1u761 and sox1aups8 alleles after FISH with kctd12.1 [magenta; pineal complex as (C), white]. n = 4 wild-types, 3 cachd1u761 mutants, 4 sox1aups8 mutants, 3 sox1aups8, cachd1u761 double mutants. (G) Dorsal views of Et(gata2a:EGFP)pku588 wild-type or cachd1u761 mutant habenulae incubated at 48 hours post fertilization (hpf) with a pulse of BrdU to label newly born neurons, then processed for immunohistochemistry at 5 dpf with antibody to GFP (magenta) and antibody to BrdU (green). DAPI (4′,6-diamidino-2-phenylindole) counterstain marks nuclei (gray). (H to J) Segmentation of confocal stacks from Et(gata2a:EGFP)pku588 wild-type or cachd1u761 mutant larvae incubated at (H) 24, (I) 32 and (J) 48 hpf with a pulse of BrdU, then processed at 5 dpf as in (G). Double-positive cells are represented in magenta; BrdU-positive only cells are indicated in green. Times of pulse indicated at top right. (K) Quantification of the proportion of BrdU-positive neurons that also expressed Et(gata2a:EGFP)pku588 (magenta) in 5 dpf wild-type or cachd1u761 larvae incubated with a pulse of BrdU at 24 hpf (all timepoints presented in fig. S11). Error bars represent 95% confidence intervals. Total number of cells and larvae for each genotype indicated in axis label in parentheses. Q′ test of equality of proportions [24 hpf, degrees of freedom (DF) = 3, χ2 = 40.94, P = 6.7 × 10⁻⁹], post hoc pairwise comparisons using a modified Marascuilo procedure with Benjamini-Hochberg correction for multiple testing, **** P ≤ 0.005. Scale bars, 50 µm in (A) to (H).

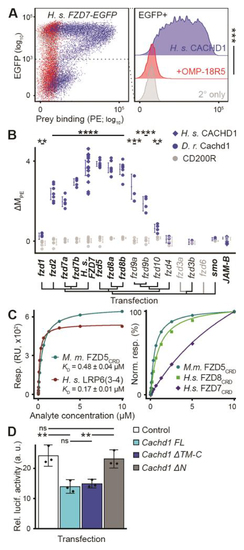
CACHD1 physically interacts with Wnt receptors LRP6 and FZD family members.

(A) (Left) Representative scatter plot of flow cytometry testing binding of FLAG-tagged CACHD1 prey protein to human FZD7-EGFP transiently transfected HEK293E cells detected by means of phycoerythrin (PE)-conjugated secondary antibody. (Right) Without (blue) or with (red) preincubation with antibody to Frizzled OMP-18R5; secondary only negative control (gray). n = 3; one-tailed paired t test (DF = 2, t = 9.53, *** P = 0.0054). (B) Dot plot of human (blue diamonds) or zebrafish (blue circles) Cachd1 or negative control CD200R (gray) prey protein binding (standardized as ΔMPE (supplementary materials, materials and methods) to cells transiently transfected with EGFP fusion protein constructs indicated (transfections verified by means of antibody labeling are indicated in bold). Each dot indicates a single experiment; horizontal bars indicate the mean, and error bars indicate 95% confidence intervals. One way Welch test of means (Cachd1 prey versus CD200R prey, not assuming equal variances; F = 132.32, DFnum = 30.00, DFdenom = 34.67, P = 5.09 × 10⁻²⁸), post hoc pairwise t tests with non-pooled standard deviations, Benjamini-Hochberg correction for multiple testing. Only statistically significant differences between Cachd1 and CD200R prey for individual transfections are presented here for clarity; ** 0.05 ≥ P > 0.01, *** 0.01 ≥ P > 0.005, **** P ≤ 0.005. (C) SPR-based determination of KD (left) for mouse CACHD1ECD analyte binding to immobilized mouse FZD5CRD (cyan) or human LRP6P3E3P4E4 (3-4, red), and normalized response curves (right) for different CACHD1ECD:FZDCRD interactions. RU, response units. (D) TOPFlash responses of HEK293 cells to WNT3A treatment after transfection with a control plasmid (white) or plasmids containing full length rodent Cachd1 (cyan), Cachd1 extracellular domain only (blue; ΔTM-C), or Cachd1 transmembrane and intracellular domains only (gray; ΔN). Mean responses are shown (n = 3 experiments; black dots indicate mean of quadruple technical replicates in each experiment); error bars idicate 95% confidence intervals. One way Welch test of means (not assuming equal variances; F = 13.202, DFnum = 3.00, DFdenom = 4.19, P = 0.014), post hoc pairwise t tests with non-pooled standard deviations, Benjamini-Hochberg correction for multiple testing. ns, P > 0.1, ** 0.05 ≥ P > 0.01.

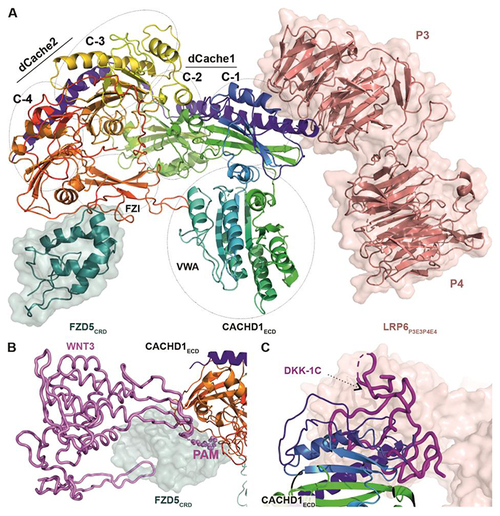
CACHD1 forms a ternary complex with FZD5 and LRP6.

(A) Cartoon representation of mouse CACHD1ECD, [rainbow-colored from N terminus (blue) to C terminus (red)] in complex with mouse FZD5CRD (cartoon and surface in teal) and human LRP6P3E3P4E4 (cartoon and surface in salmon pink). The position of the four cache (C-1, -2, -3 and -4), VWA and FZD interaction (FZI) domains of CACHD1ECD are indicated (PDB ID 8S7C). (B) Superimposed structures of the FZD8:WNT3 complex (PDB ID 6AHY) with the FZD5CRD:CACHD1ECD complex. WNT3 is shown as a violet cartoon tube with palmitoleic acid (PAM) as spheres. (C) Superimposed structures of the LRP6:DKK1-C complex (PDB ID 5FWW) with the CACHD1ECD:LRP6P3E3P4E4 complex. DKK1-C is shown as a magenta cartoon tube.

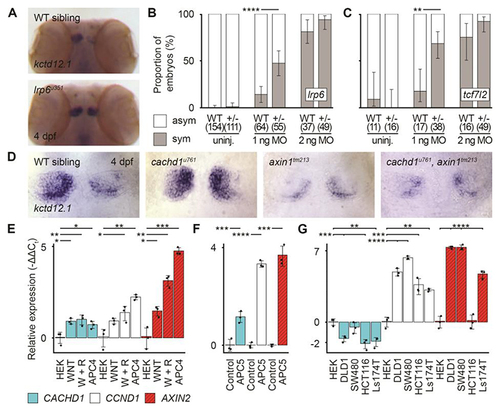
cachd1 interacts genetically with Wnt pathway components.

(A) Dorsal views of wholemount 4 dpf wild-type sibling (n = 12) and lrp6u351 mutant (n = 9) heads stained for expression of kctd12.1. (B and C) Graphs showing the percentage of (B) 4 dpf wild-type siblings and lrp6u349/+ larvae or (C) wild-type siblings and tcf7l2zf55/+ larvae with (gray; sym) or without (white; asym) a symmetric bilateral left phenotype in uninjected larvae and larvae injected with a suboptimal (1 ng) or standard dose (2 ng) of cachd1 morpholino (MO1). Error bars indicate 95% confidence intervals of the proportion. Q′ test of equality of proportions [(B) DF = 2, χ2 = 18.71, P = 8.66 × 10⁻⁵; (C) DF = 2, χ2 = 7.93, P = 0.019) and post hoc modified Marascuilo procedure with Benjamini-Hochberg correction for multiple testing. (D) Dorsal views of the habenulae of wholemount 4 dpf larvae from an incross of cachd1u761 and axin1tm213 mutants, showing expression of kctd12.1. n = 5 wild-types, 6 cachd1u761 mutants, 3 axin1tm213 mutants and 3 cachd1u761, axin1tm213 double mutants. (E to G) Quantitative RT-PCR data showing relative expression (-ΔΔCt values) of CACHD1 and known Wnt-responsive genes (CCND1, AXIN2) in (E) HEK293 (HEK) cells untreated, incubated with WNT3A alone (WNT) or WNT3A and RSPONDIN1-conditioned media (W + R), or stable APC mutant cells (APC4); (F) wild-type (Control) and Apc mutant (APC5) mouse organoids; and (G) colorectal cancer-derived cell lines with mutations in Wnt pathway genes (APC mutants, DLD1, SW480; CTNNB1 mutants, HCT116, Ls174T). Data is presented as mean -ΔΔCt values compared to expression of ACTB (human) or Hrpt1 (mouse) reference genes and untreated controls (HEK293 cells or wild-type organoid). Individual points indicate biological replicates (each an average of three technical replicates), n = 3; error bars indicate 95% confidence intervals. One way Welch test of means [not assuming equal variances; (A) F = 58.83, DFnum = 11.00, DFdenom = 9.41, P = 3.03 × 10⁻⁷; (B) F = 225.66, DFnum = 5.00, DFdenom = 5.16, P = 5.12 × 10⁻⁶; (C) F = 236.49, DFnum = 14.00, DFdenom = 11.33, P = 7.67 × 10⁻¹²], post hoc pairwise t tests with non-pooled standard deviations and Benjamini-Hochberg correction for multiple testing; only statistically significant differences with control samples (HEK or Control) are presented here for clarity. * 0.1 ≥ P > 0.05, ** 0.05 ≥ P > 0.01, *** 0.01 ≥ P > 0.005, **** P ≤ 0.005.

Acknowledgments
This image is the copyrighted work of the attributed author or publisher, and ZFIN has permission only to display this image to its users. Additional permissions should be obtained from the applicable author or publisher of the image. Full text @ Science