|
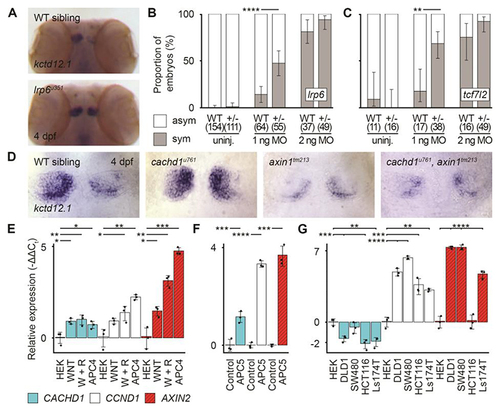
cachd1 interacts genetically with Wnt pathway components. (A) Dorsal views of wholemount 4 dpf wild-type sibling (n = 12) and lrp6u351 mutant (n = 9) heads stained for expression of kctd12.1. (B and C) Graphs showing the percentage of (B) 4 dpf wild-type siblings and lrp6u349/+ larvae or (C) wild-type siblings and tcf7l2zf55/+ larvae with (gray; sym) or without (white; asym) a symmetric bilateral left phenotype in uninjected larvae and larvae injected with a suboptimal (1 ng) or standard dose (2 ng) of cachd1 morpholino (MO1). Error bars indicate 95% confidence intervals of the proportion. Q′ test of equality of proportions [(B) DF = 2, χ2 = 18.71, P = 8.66 × 10⁻⁵; (C) DF = 2, χ2 = 7.93, P = 0.019) and post hoc modified Marascuilo procedure with Benjamini-Hochberg correction for multiple testing. (D) Dorsal views of the habenulae of wholemount 4 dpf larvae from an incross of cachd1u761 and axin1tm213 mutants, showing expression of kctd12.1. n = 5 wild-types, 6 cachd1u761 mutants, 3 axin1tm213 mutants and 3 cachd1u761, axin1tm213 double mutants. (E to G) Quantitative RT-PCR data showing relative expression (-ΔΔCt values) of CACHD1 and known Wnt-responsive genes (CCND1, AXIN2) in (E) HEK293 (HEK) cells untreated, incubated with WNT3A alone (WNT) or WNT3A and RSPONDIN1-conditioned media (W + R), or stable APC mutant cells (APC4); (F) wild-type (Control) and Apc mutant (APC5) mouse organoids; and (G) colorectal cancer-derived cell lines with mutations in Wnt pathway genes (APC mutants, DLD1, SW480; CTNNB1 mutants, HCT116, Ls174T). Data is presented as mean -ΔΔCt values compared to expression of ACTB (human) or Hrpt1 (mouse) reference genes and untreated controls (HEK293 cells or wild-type organoid). Individual points indicate biological replicates (each an average of three technical replicates), n = 3; error bars indicate 95% confidence intervals. One way Welch test of means [not assuming equal variances; (A) F = 58.83, DFnum = 11.00, DFdenom = 9.41, P = 3.03 × 10⁻⁷; (B) F = 225.66, DFnum = 5.00, DFdenom = 5.16, P = 5.12 × 10⁻⁶; (C) F = 236.49, DFnum = 14.00, DFdenom = 11.33, P = 7.67 × 10⁻¹²], post hoc pairwise t tests with non-pooled standard deviations and Benjamini-Hochberg correction for multiple testing; only statistically significant differences with control samples (HEK or Control) are presented here for clarity. * 0.1 ≥ P > 0.05, ** 0.05 ≥ P > 0.01, *** 0.01 ≥ P > 0.005, **** P ≤ 0.005.
|