FIGURE SUMMARY
Title

Zebrafish nampt-a mutants are viable despite perturbed primitive hematopoiesis

Authors
Pomreinke, A.P., Müller, P.
Source
Full text @ Hereditas

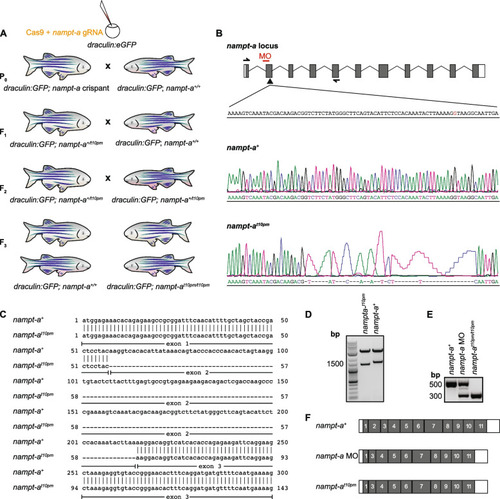
CRISPR/Cas9-mediated generation of nampt-a mutants for comparison to morpholino-induced mis-spliced transcripts. A To generate homozygous nampt-at10pm mutants using CRISPR/Cas9, draculin:GFP embryos were injected with Cas9 and gRNA targeting exon 2 of the nampt-a gene. P0nampt-a crispants were backcrossed to draculin:GFP fish, and heterozygous mutant progeny was raised to adulthood (F1). Of these fish, the nampt-at10pm mutant allele was identified to have exon 2 absent in the mature transcript. F1 fish were backcrossed to draculin:GFP to further eliminate potential off-target mutations. F2 fish were in-crossed to establish homozygous nampt-at10pm mutants (F3). F3 progeny homozygous for the wild-type allele nampt-a+ were also raised to serve as controls for the genetic background. B Schematic of the nampt-a locus. Boxes represent exons, white bars represent UTRs, and thin black lines represent introns. The arrowhead marks the gRNA target site for CRISPR/Cas9-mediated mutagenesis. The red bar indicates the morpholino (MO) binding site at the 3’ splice site of the intron 1 and exon 2 splice junction on nampt-a pre-mRNA. Half-headed arrows represent the primer-annealing sites used to amplify and sequence nampt-a mature mRNA from exon 1 to exon 5. The inlet represents a short segment of the exon 2 sense strand including the 5’ splice site ‘G’ in red between exon 2 and intron 2. Lower panels show Sanger sequences of wild-type nampt-a and the nampt-at10pm allele with a 47 bp indel. C Alignment of wild-type nampt-a+ and nampt-at10pm cDNA shows that exon 2 is absent in nampt-at10pm mutant transcripts. D Cloning of wild-type nampt-a+ and nampt-at10pm into the pCS2( +) vector with subsequent release of inserts by restriction digestion shows that the nampt-at10pm allele is shorter than the wild-type cDNA. E PCR products amplified from wild-type nampt-a, nampt-a morphants (nampt-a MO), and nampt-at10pm/t10pm cDNA using primers shown in (B) indicate similar splicing defects in morphants and mutants, albeit substantial wild-type mRNA is still present in the morphants. F Schematic of nampt-a wild-type mature mRNA aligned to nampt-a morphant and nampt-at10pm mutant mature mRNA. Exons are shown in gray and UTRs in white boxes. Exon 2 is spliced out in both loss-of-function approaches

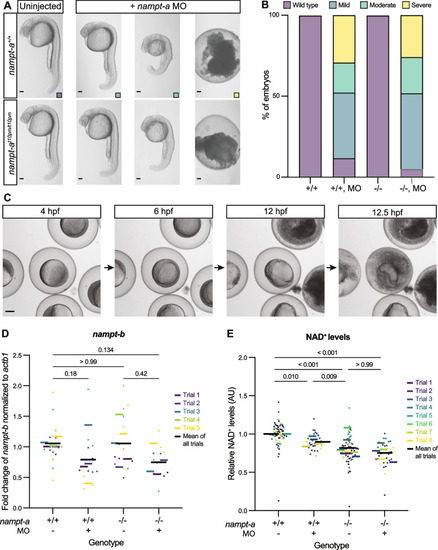
The nampt-a morpholino has off-target effects that lead to the maldevelopment of wild-type and mutant nampt-a embryos. A Phenotypes of nampt-a+/+ and nampt-at10pm/t10pm embryos injected with nampt-a morpholino (nampt-a MO). Scale bars represent 100 µm. B Phenotype distributions of nampt-a+/+ (+ / +) and nampt-at10pm/t10pm (-/-) embryos injected with nampt-a MO. Results are a combination of four experimental trials. + / + , n = 366; + / + with MO, n = 232; -/-, n = 351, and -/- with MO, n = 201. C Time-lapse imaging of embryos with severe phenotypes injected with nampt-a MO at 4, 6, 12 and 12.5 h post-fertilization. Scale bar represents 100 µm. D Wild-type nampt-a+/+ (+ / +) and mutant nampt-at10pm/t10pm (-/-) embryos were injected with nampt-a MO. Embryos were assayed at 1 dpf for nampt-b expression by qRT-PCR, and fold change in expression was calculated using the ∆∆Ct method [26]. Each point represents one biological sample of ten embryos pooled for RNA extraction. Each colored line represents the average from separate experimental trial days, and the black line shows the average from all trials. For statistical analysis in (D, E), the Kruskal–Wallis non-parametric test was applied followed by Dunn’s multiple comparison test. E Each point represents NAD+ levels in individuals relative to uninjected nampt-a+/+ embryos. Each colored line represents the average from separate experimental trial days, and the black line shows the average from all trials

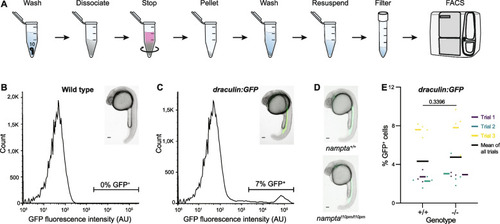
nampt-a+/+ and nampt-at10pm/t10pm embryos have comparable draculin:GFP-positive cell populations. A To quantify lateral plate mesoderm cells, draculin:GFP zebrafish embryos were homogenized, and GFP+ cells were counted using fluorescence activated cell sorting (FACS). B Wild-type embryos not expressing GFP were used as controls to establish a cut-off for GFP cells. C Example of FACS read-out of GFP+ cells (green, inset) in draculin:GFP embryos that are detected above the baseline cut-off set in (B). D Images of nampt-a+/+ and nampt-at10pm/t10pm embryos in the draculin:GFP background before homogenization and quantification by FACS. E Quantification of GFP+ cells in nampt-a+/+ (+ / +) and nampt-at10pm/t10pm (-/-) embryos. Each point represents one biological sample of ten pooled embryos. Each colored line represents the average from separate experimental trial days, and the black bar shows the mean of all trials. For statistical analysis, the Mann–Whitney test was applied to determine the p-value. Scale bars in B-D represent 100 µm

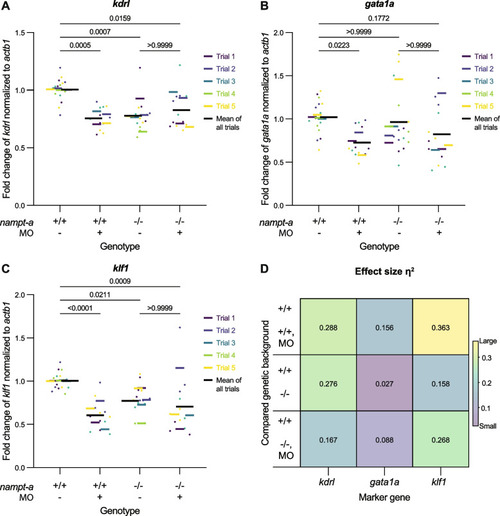
Expression of hemangioblast/endothelial and erythrocyte maturation markers in nampt-a loss-of-function conditions. nampt-a+/+ (+ / +) and nampt-at10pm/t10pm (-/-) embryos were injected with nampt-a morpholino (MO). Embryos were assayed at 1 dpf for the expression of the hemangioblast/endothelial marker kdrl (A) and the erythrocyte markers gata1a (B) and klf1 (C) by qRT-PCR. Fold change was calculated using the ∆∆Ct method [26]. Each point represents one biological sample of ten embryos pooled for RNA extraction. Each colored line represents the average from separate experimental trial days with the black line representing the average from all trials. For statistical analysis, the Kruskal–Wallis non-parametric test was applied followed by Dunn’s multiple comparison test to determine p-values. D Effect size (η2) for the Kruskal–Wallis test to compare each group

Acknowledgments
This image is the copyrighted work of the attributed author or publisher, and ZFIN has permission only to display this image to its users. Additional permissions should be obtained from the applicable author or publisher of the image. Full text @ Hereditas