- Title
-
CHD7 regulates craniofacial cartilage development via controlling HTR2B expression
- Authors
- Breuer, M., Rummler, M., Singh, J., Maher, S., Zaouter, C., Jamadagni, P., Pilon, N., Willie, B.M., Patten, S.A.
- Source
- Full text @ J. Bone Miner. Res.
|
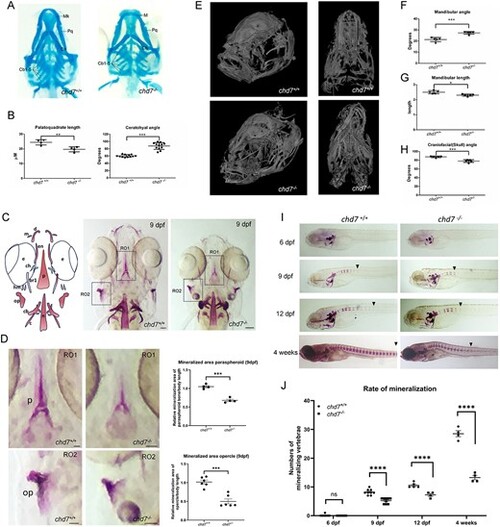
Cartilage and bone defects in chd7-/- mutant larvae. (A) Alcian blue staining of 6 dpf chd7+/+ and chd7-/- zebrafish larvae, ventral view (Mk: Merkel?s cartilage; Pq: palatoquadrate; Ch: ceratohyal; cb1-5: ceratobranchial cartilages 1-5). (B) Palatoquadrate length (left; n = 4 for both genotypes and ceratohyal angle (right; n = 12 for both genotypes) of chd7+/+ and chd7-/-. (C) Graphical illustration of craniofacial mineralized tissue in 9 dpf old larvae and Alizarin Red staining of 9 dpf chd7+/+ and chd7-/- zebrafish larvae, ventral view (m:maxilla; d:dentary; en:entopterygoid; e:eye; p: parasphenoid; ch: ceratohyal; br1: branchiostegal ray1; hm: hyomandibular; op:opercle; cb: ceratobranchial 5; n:notochord). Scale bar = 50 ?m. (D) Magnified regions of interest (RO1: paraspheroid and RO2: opercle) of Alizarin Red staining in C and quantitative analysis of mineralized area normalized to embryo body length (paraspheroid bone: n = 4 for both genotypes; and opercle: n = 6 for both genotypes). Scale bar = 25 ?m. (E) MicroCT analysis of 1-year old adult skulls of chd7+/+ and chd7-/- in semilateral and ventral view. (F-H) Mandibular angle, length and Craniofacial angle of 1-year old fish. (I) Alizarin Red staining to show rate of mineralization from 6 dpf to 4 weeks post fertilization chd7+/+ and chd7-/- zebrafish larvae. Arrows indicate most posterior mineralized centra of vertebrae. (J) Quantitative analysis of the rate of mineralization from 6 dpf to 4 weeks post fertilization in chd7+/+ (n = 4-9) and chd7-/- (n = 4-9) zebrafish larvae. Significance: *P < 0.05; **P < 0.01; ***P < 0.001; ****P < 0.0001; ns = not significant. |
|
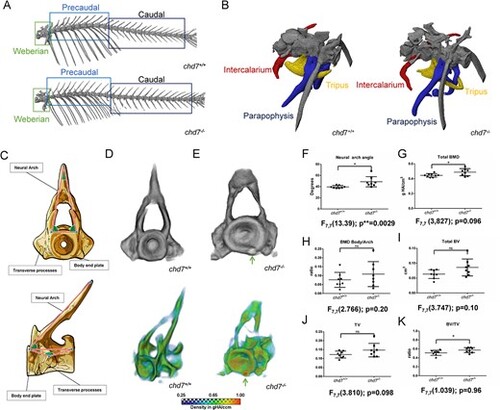
Precaudal vertebrae and Weberian apparatus. (A) Representative microCT overview image of the spinal column from a 1-year old chd7+/+ and a chd7-/- adult zebrafish. (B) MicroCT Image of the Weberian apparatus from a 1-year old chd7+/+ and a chd7-/- mutants, indicating structures of intercalarium (red), tripus (yellow) and parapophysis (blue). (C) Sketch diagram of precaudal vertebrae (frontal and lateral) indicating structure and measured angles. (D, E) (top) Individual rendering of precaudal vertebrae, frontal view of tissue over 0.41 g HA/cm3 threshold and (bottom) vBMD intensity map (Range blue-red; 0.41 ? 1.00 g HA/cm3) showing morphological abnormalities and growth zone malformations with highly mineralized inclusions (arrow). (F) Neural arch angle. (G) vBMD of whole vertebrae showing increasing density. (H) Increasing ratio of vBMD arch/vertebrae body. (I-K) BV, TV and ratio BV/TV (n = 8/genotype were analyzed). * denotes P < 0.05 and ns = not significant; Student?s t-test PHENOTYPE:
|
|
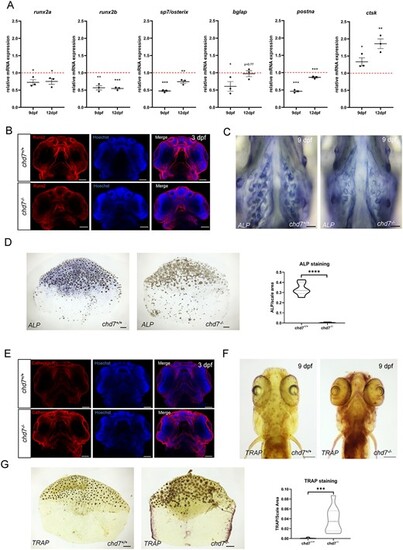
Osteoblasts and Osteoclasts in early development and adults. (A) RT-qPCR of osteoblast (runx2a, runx2b, sp7/osterix, bglap and postna) and osteoclast related genes (ctsk) screened at 9 dpf and 12 dpf in chd7+/+ and chd7-/-larvae. (B) Immunohistochemistry of osteoblast marker Runx2 (red) and nuclei maker Hoechst (blue) in 3dpf chd7+/+ (n = 5) and chd7-/- (n = 5) larvae. Scale bar = 60 ?m. (C) Alkaline Phosphatase staining (ALP; blue) for osteoblasts in craniofacial region of 9dpf larvae (n = 10 for both genotypes). Scale bar = 200 ?m. (D) Alkaline Phosphatase staining (ALP; blue) for osteoblasts in adult scales and quantitative analysis determined by signal/area ratio (n = 6 for chd7+/+ and n = 8 for chd7-/-). Scale bar = 100 ?m. (E) Immunohistochemistry of osteoclast marker cathepsin K (red) and nuclei maker Hoechst (blue) in 3dpf chd7+/+ (n = 5) and chd7-/- (n = 5) larvae. Scale bar = 60 ?m. (F) TRAP staining for osteoclasts in craniofacial region of 9dpf larvae (n = 10 for both genotypes). Scale bar = 100 ?m. (G) TRAP staining for osteoclasts in adult scales and quantitative analysis determined by signal/area ratio (n = 10 for both genotypes). Scale bar = 100 ?m. *p < 0.05; **p < 0.01 ***p < 0.001; ***p < 0.0001. EXPRESSION / LABELING:
PHENOTYPE:
|
|
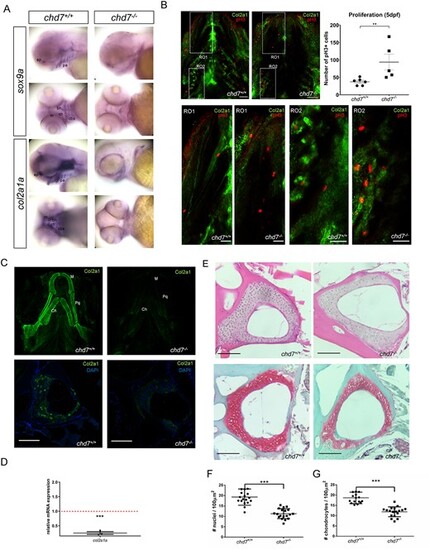
ECM Collagen2a1 deficiency in chd7-/- larvae and adults. (A) WISH of sox9a and col2a1a in craniofacial regions of chd7+/+ and chd7-/- 3dpf larvae, lateral and ventral view (ep: ethmoid plate; pa: palatoquadrate; m: Meckel?s cartilage; ch: ceratohyal; bh: basihyal; cbs: ceratobranchials). (B) Immunohistochemistry for proliferation marker pH 3 (red) and Col2a1 (green) in the craniofacial region of 5dpf chd7+/+(n = 6) and chd7-/- (n = 5) larvae (top; scale bar = 40 ?m) and magnified regions of interest (RO1: Region of the Meckel?s cartilage and ceratohyal; RO2: ceratobranchials) (bottom panels; scale bar = 20 ?m.) with quantitative analysis of pH 3 positive cells of the craniofacial region (top right panel). (C) Immunofluorescence of Col2a1 in 5 dpf chd7+/+(n = 9) and chd7-/- (n = 8) larvae, ventral view of craniofacial cartilage (top panel; De: dentary; Pq: palatoquadrate; Ch: ceratohyal). Immunofluorescence of Col2a1 in precaudal vertebrae sections of chd7+/+ and chd7-/- mutants with Col2a1 in green and DAPI in blue (bottom panel). (D) RT-qPCR of col2a1a at 9dpf, relative fold change in comparison to chd7+/+ (red dotted line). (E) H&E staining of precaudal vertebrae section of chd7+/+ and chd7-/- mutants (top). Safranin O/fast green staining of Weberian and precaudal vertebrae sections of chd7+/+ and chd7-/- mutants showing cartilage in red (bottom). (F,G) Total nuclei count in Weberian and precaudal vertebral cartilage detected in H&E staining per 100?m2 in chd7+/+ (N = 4, n = 17) and chd7-/- (N = 4, n = 18) and Chondrocyte nuclei count in precaudal vertebral cartilage detected in Safranin O/fast green staining per 100?m2 chd7+/+ (N = 4, n = 18) and chd7-/- (N = 4, n = 19). Scale bar represents 100 ?m. Significance: **P < 0.01 ***P < 0.001. EXPRESSION / LABELING:
PHENOTYPE:
|
|
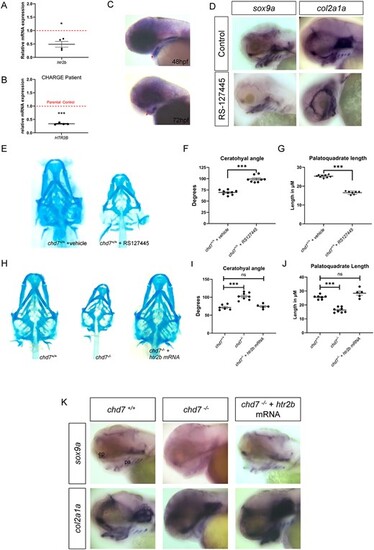
Role of Htr2b in craniofacial development. (A) RT-qPCR of htr2b at 3dpf, relative fold change in comparison to chd7+/+(N = 4). (B) RT-qPCR of HTR2B mRNA in a LCL from a CS patient in comparison to parental controls (N = 4). (C) WISH of htr2b in 48 hpf and 72hpf zebrafish, lateral view. Red asterisk indicates expression in craniofacial structures. (D) WISH of sox9a and col2a1a in craniofacial regions of control or Htr2b inhibitor treated larvae, lateral view. (E) Alcian blue staining of 6 dpf larvae treated with vehicle (DMF) or Htr2b inhibitor RS127445. (F, G) Statistical analysis of palatoquadrate length and ceratohyal angle in vehicle or inhibitor treated larvae (n = 9 for chd7+/+ and n = 8 for chd7-/-). (H) Alcian blue staining of 6 dpf larvae of wildtype, chd7-/- and chd7-/- injected with htr2b mRNA. (I,J) Statistical analysis of palatoquadrate length and ceratohyal angle chd7-/-(n = 6-7), chd7-/- (n = 8) and chd7-/- injected with htr2b mRNA(n = 5). (K) WISH of sox9a and col2a1a in craniofacial regions of 72hpf wildtype, chd7-/- and chd7-/- injected with htr2b mRNA larvae, lateral view (ep: ethmoid plate and pa: palatoquadrate). Significance of Student?s t-test or ANOVA with: *P < 0.05; **P < 0.01; ***P < 0.001; ns = not significant. EXPRESSION / LABELING:
PHENOTYPE:
|

