- Title
-
Inhibition of the glucocorticoid receptor attenuates proteinuric kidney diseases in multiple species
- Authors
- Stamellou, E., Agrawal, S., Siegerist, F., Buse, M., Kuppe, C., Lange, T., Buhl, E.M., Alam, J., Strieder, T., Boor, P., Ostendorf, T., Gr÷ne, H.J., Floege, J., Smoyer, W.E., Endlich, N., Moeller, M.J.
- Source
- Full text @ Nephrol. Dial. Transplant.
|
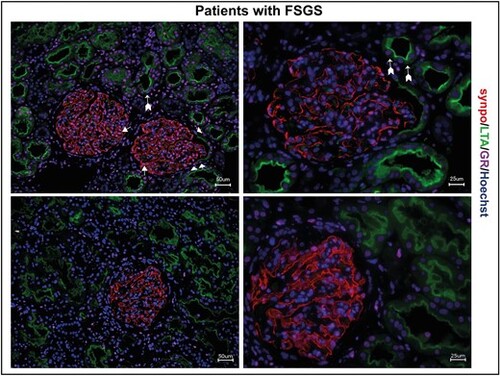
GR expression in human MCD/FSGS. Immunofluorescence staining of human kidney biopsies of two patients with FSGS. GR expression (magenta) is visible in all glomerular cells, including podocytes (synaptopodin; red, arrow) and parietal epithelial cells (arrowheads), but also in proximal tubule cells (LTA; green, arrows with tails). Scale bars 25 ?m and 50 ?m. |
|
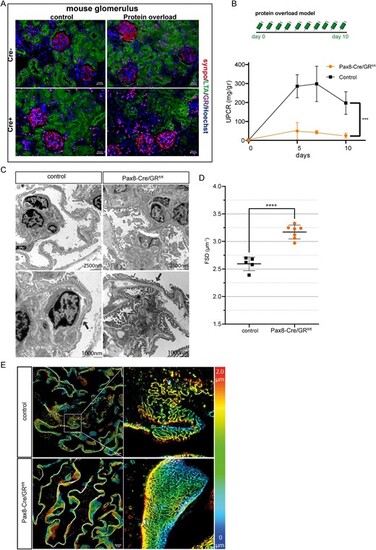
Genetic Inactivation of glucocorticoid signaling and protein overload in these mice. (A) Immunofluorescence costaining of GR (magenta), podocyte marker synaptopodin (synpo; red), proximal tubule cells (LTA; red) and DNA (Hoechst; blue) confirmed the selective deletion of GR in renal epithelial cells. (B) Schme of the protein overload model. Proteinuria was induced by bovine albumin injections (15 mg/g/body weight daily for 10 days (n = 6 per group) (upper). UPCR in mg/g creatinine in wildtype mice (control) and transgenic mice (ko) following protein overload (n = 6 per group) (lower graph). (C) Transmission electron microscopy from wildtype control mice and transgenic mice with protein overload (Day 10). There is reduced podocyte effacement in transgenic mice compared with wildtype controls. (D) Quantification of slit diaphragm density width in wildtype control and transgenic mice. Data are expressed as means ▒ SD. ****P < .0001 by Student's t-test. (E) Images of 3D-reconstructed SIM volumes showing the spatial aspect of the slit diaphragm on the capillary loops in control and ko mice. The same colors indicate the same Z-position within the total Z-volume of 4.5 Ám. Data are expressed as means ▒ SD. ***P < .001, ****P < .0001 by t-test and two-way ANOVA. |
|
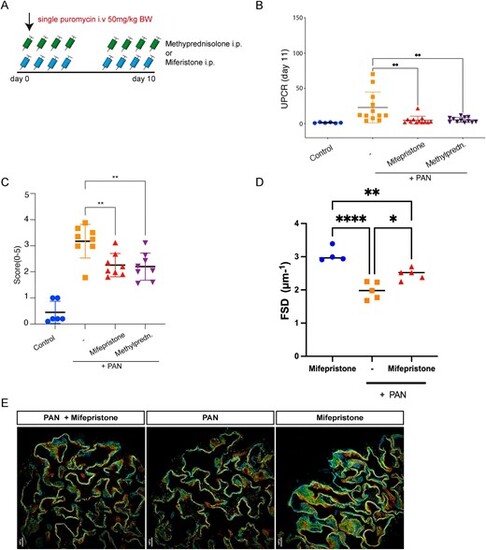
Pharmacological inhibition in PAN model. (A) Scheme of the PAN model. Proteinuria in rats was induced by a single intravenous (i.v.) puromycin aminonucleoside injection at 50 mg/kg body weight. The rats were then treated for 9 days with either methylprednisolone or mifepristone by i.p. injection (n = 6?12) (B) UPCR in mg/g creatinine on Day 11 in PAN, healthy control rats and treated rats. (C) PAS staining in methylprednisolone-treated, mifepristone-treated and untreated PAN rats showing no evidence of FSGS. (D) Histological quantification of glomerular desmin expression. (E) Quantification of slit diaphragm density width in PAN rats treated or not with mifepristone. Mifepristone treatment resulted in increased slit diaphragm density compared with vehicle treated rats. Data are expressed as means ▒ SD. ****P < .0001 by Student's t-test. (G) Images of 3D-reconstructed SIM volumes showing the spatial aspect of the slit diaphragm on the capillary loops in the different groups. The same colors indicate the same Z-position within the total Z-volume of 4.5 Ám. Data represent means ▒ SD *P < .05, **P < .001 by Student's t-test or by 1-way ANOVA followed by Bonferroni's post hoc test. |
|
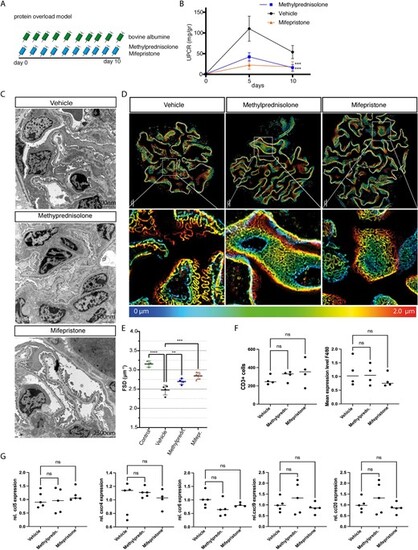
Pharmacological inhibition in murine protein-overload model. (A) Timeline of the experiment. Proteinuria was induced by bovine albumin injections [15 mg/g/body weight (bw) daily for 10 days (n = 6 per group)]. Mice were treated daily with either methylprednisolone 2.5 mg/kg bw or mifepristone 20 mg/kg bw or 0.9% NaCl (vehicle). (B) Proteinuria in vehicle-treated controls, and methylprednisolone- and mifepristone-treated mice. (C) Transmission electron microscopy of vehicle-treated controls, and methylprednisolone- and mifepristone-treated mice. Foot process effacement is present in vehicle-treated mice after induction of protein overload. Treatment with methylprednisolone or mifepristone preserved podocyte morphology and reduced podocyte effacement. (D) Images of 3D-reconstructed SIM volumes showing the spatial aspect of the meandering slit diaphragm on the capillary loops in vehicle-, mifepristione- and methylprednisolone-treated mice. In mifepristone- and methylprednisolone-treated mice, kidneys show a regular staining pattern with single foot process (FP) bridged by a meandering slit diaphragm in between. In the vehicle-treated mice the slit diaphragm appears less meandering and the foot process effaced. The same colors indicate the same Z-position within the total Z-volume of 4.5 Ám. (E) Quantification of slit diaphragm density (FSD) in vehicle-, methylprednisolone- or mifepristone-treated mice with protein overload and healthy control mice. Both methylprednisolone and mifepristone resulted in increased slit diaphragm density compared with vehicle-treated mice. (F) Quantification of CD3+ cells in vehicle-, methylprednisolone- and mifepristone-treated mice (left graph). Quantification of F4/80 expression among the different experimental groups (right graph). (G) Relative mRNA expression of ccl5, cxcr4, ccr6, cxcl9 and ccl20 among the experimental groups. No significant differences were observed. Data are expressed as means ▒ SD. ns: not significant, **P < .01, ***P < .001, ****P < .0001 by one-way and two-way ANOVA followed by Bonferroni's post hoc test. |
|
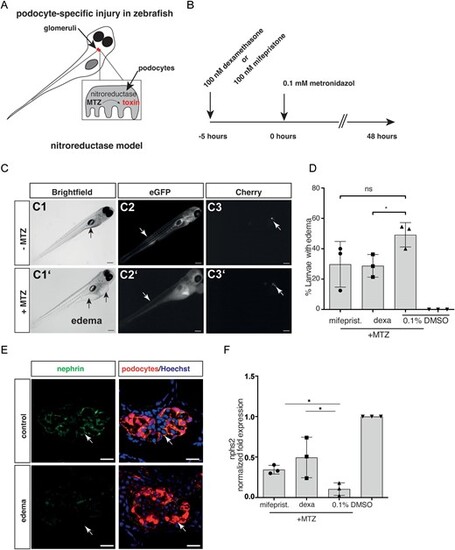
Pharmacological inhibition in zebrafish model. (A) Schematic of the zebrafish model. Zebrafish larvae (age 6 days post-fertilization) have a single glomerulus (in red) fused to a pair of tubules. If podocytes are partially depleted upon treatment with the prodrug MTZ, zebrafish larvae become proteinuric and display pericardial edema formation. (B) Timeline of the experiment. Animals were treated for 5 h with dexamethasone or mifepristone prior to addition of MTZ (i.e. induction of podocyte damage). (C) Edema formation in zebrafish larvae exposed to MTZ. (C1, C1?) Images of larvae with and without edema. Edematous larvae exhibit pericardial, yolk sac (arrows in C1 and C1?) and periorbital edema. (C2) Larvae with edema show decreased gc-eGFP fluorescence in the vasculature (arrows indicating segmental tail vessels in C2 and C2?), indicating a leaky filtration barrier, and decrease of mCherry fluorescence in the glomerulus (arrows in C3 and C3?). Scale bar: 100 Ám. (D) Analysis of edema formation, a parameter of glomerular permeability defect, in mifepristone-, dexamethasone- and vehicle-treated zebrafish larvae. Edema formation is reduced by glucocorticoid agonism and antagonism. (E) Confocal laser scanning micrographs of glomeruli show decreased staining for nephrin (green) exclusively in larvae with edema compared with healthy control larvae (scale bar represents 10 Ám). (F) Mean values of qRT-PCR for nphs2 mRNA levels normalized to 18 s rRNA and compared with DMSO controls of whole larval lysates are shown. A 48-h exposure to 100 ÁM MTZ reduced nphs2 mRNA levels to 0.06. Co-treatment with 100 nM dexamethasone or with 100 nM mifepristone resulted in an elevated nphs2 expression (0.31 ▒ 0.05 and 0.25 ▒ 0.11, respectively), compared with control. The results of three independent experiments (n = 20 larvae per experiment) are expressed as mean mRNA levels ▒ SD. *P < .05, by one-way ANOVA followed by Bonferroni's post hoc test. Data represent means ▒ SD. |
|
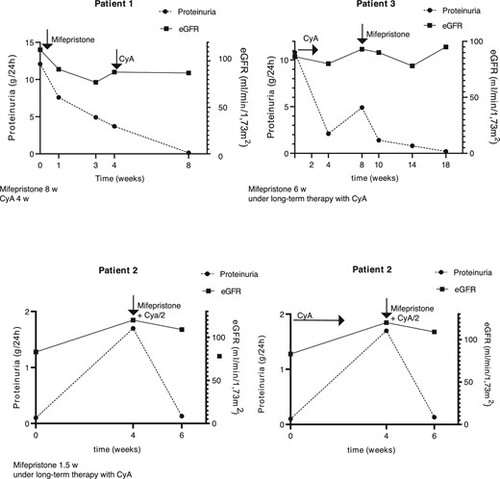
Glucocorticoid receptor antagonism in nephrotic patients. Course of proteinuria and eGFR in three patients treated with mifepristone. CyA/2: reduced-dose CyA. |

