Fig. 4
- ID
- ZDB-FIG-240628-39
- Publication
- Stamellou et al., 2023 - Inhibition of the glucocorticoid receptor attenuates proteinuric kidney diseases in multiple species
- Other Figures
- All Figure Page
- Back to All Figure Page
|
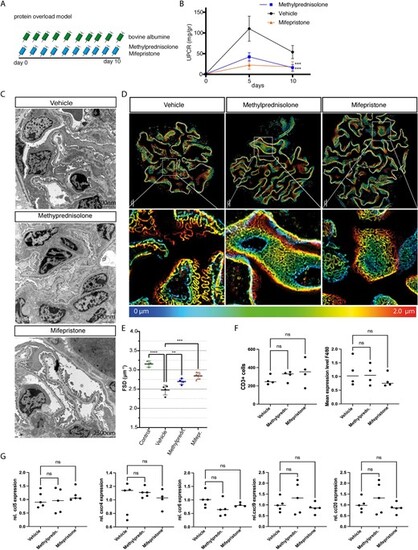
Pharmacological inhibition in murine protein-overload model. (A) Timeline of the experiment. Proteinuria was induced by bovine albumin injections [15 mg/g/body weight (bw) daily for 10 days (n = 6 per group)]. Mice were treated daily with either methylprednisolone 2.5 mg/kg bw or mifepristone 20 mg/kg bw or 0.9% NaCl (vehicle). (B) Proteinuria in vehicle-treated controls, and methylprednisolone- and mifepristone-treated mice. (C) Transmission electron microscopy of vehicle-treated controls, and methylprednisolone- and mifepristone-treated mice. Foot process effacement is present in vehicle-treated mice after induction of protein overload. Treatment with methylprednisolone or mifepristone preserved podocyte morphology and reduced podocyte effacement. (D) Images of 3D-reconstructed SIM volumes showing the spatial aspect of the meandering slit diaphragm on the capillary loops in vehicle-, mifepristione- and methylprednisolone-treated mice. In mifepristone- and methylprednisolone-treated mice, kidneys show a regular staining pattern with single foot process (FP) bridged by a meandering slit diaphragm in between. In the vehicle-treated mice the slit diaphragm appears less meandering and the foot process effaced. The same colors indicate the same Z-position within the total Z-volume of 4.5 µm. (E) Quantification of slit diaphragm density (FSD) in vehicle-, methylprednisolone- or mifepristone-treated mice with protein overload and healthy control mice. Both methylprednisolone and mifepristone resulted in increased slit diaphragm density compared with vehicle-treated mice. (F) Quantification of CD3+ cells in vehicle-, methylprednisolone- and mifepristone-treated mice (left graph). Quantification of F4/80 expression among the different experimental groups (right graph). (G) Relative mRNA expression of ccl5, cxcr4, ccr6, cxcl9 and ccl20 among the experimental groups. No significant differences were observed. Data are expressed as means ± SD. ns: not significant, **P < .01, ***P < .001, ****P < .0001 by one-way and two-way ANOVA followed by Bonferroni's post hoc test. |

