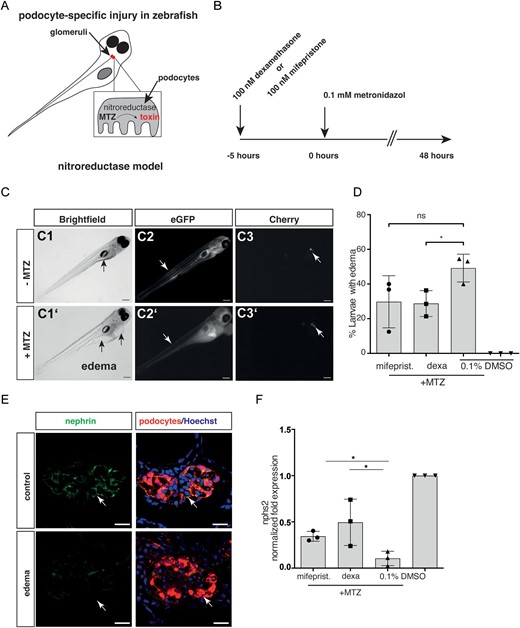
Fig. 5 Pharmacological inhibition in zebrafish model. (A) Schematic of the zebrafish model. Zebrafish larvae (age 6 days post-fertilization) have a single glomerulus (in red) fused to a pair of tubules. If podocytes are partially depleted upon treatment with the prodrug MTZ, zebrafish larvae become proteinuric and display pericardial edema formation. (B) Timeline of the experiment. Animals were treated for 5 h with dexamethasone or mifepristone prior to addition of MTZ (i.e. induction of podocyte damage). (C) Edema formation in zebrafish larvae exposed to MTZ. (C1, C1?) Images of larvae with and without edema. Edematous larvae exhibit pericardial, yolk sac (arrows in C1 and C1?) and periorbital edema. (C2) Larvae with edema show decreased gc-eGFP fluorescence in the vasculature (arrows indicating segmental tail vessels in C2 and C2?), indicating a leaky filtration barrier, and decrease of mCherry fluorescence in the glomerulus (arrows in C3 and C3?). Scale bar: 100 Ám. (D) Analysis of edema formation, a parameter of glomerular permeability defect, in mifepristone-, dexamethasone- and vehicle-treated zebrafish larvae. Edema formation is reduced by glucocorticoid agonism and antagonism. (E) Confocal laser scanning micrographs of glomeruli show decreased staining for nephrin (green) exclusively in larvae with edema compared with healthy control larvae (scale bar represents 10 Ám). (F) Mean values of qRT-PCR for nphs2 mRNA levels normalized to 18 s rRNA and compared with DMSO controls of whole larval lysates are shown. A 48-h exposure to 100 ÁM MTZ reduced nphs2 mRNA levels to 0.06. Co-treatment with 100 nM dexamethasone or with 100 nM mifepristone resulted in an elevated nphs2 expression (0.31 ▒ 0.05 and 0.25 ▒ 0.11, respectively), compared with control. The results of three independent experiments (n = 20 larvae per experiment) are expressed as mean mRNA levels ▒ SD. *P < .05, by one-way ANOVA followed by Bonferroni's post hoc test. Data represent means ▒ SD.
Image
Figure Caption
Figure Data
Acknowledgments
This image is the copyrighted work of the attributed author or publisher, and
ZFIN has permission only to display this image to its users.
Additional permissions should be obtained from the applicable author or publisher of the image.
Full text @ Nephrol. Dial. Transplant.

