FIGURE SUMMARY
Title

Proteomic analysis unveils Gb3-independent alterations and mitochondrial dysfunction in a gla-/- zebrafish model of Fabry disease

Authors
Elsaid, H.O.A., Rivedal, M., Skandalou, E., Svarstad, E., Tøndel, C., Birkeland, E., Eikrem, Ø., Babickova, J., Marti, H.P., Furriol, J.
Source
Full text @ J Transl Med

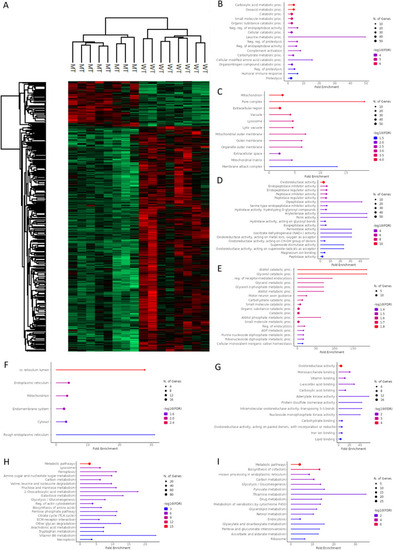
Proteomic comparison of kidneys from wild-type (WT; n = 8) and mutant (MU; n = 8) zebrafish. Gene ontology (GO) enrichment analysis and KEGG analysis. A Hierarchical clustering for differentially expressed proteins between WT and MT. Downregulated proteins in MU compared to WT in B GO Biological Process analysis; C GO Cellular component analysis; D GO Molecular function analysis. Upregulated proteins in MU compared with WT in E GO Biological Process analysis; F GO Cellular component analysis; G GO Molecular function analysis. H KEGG pathways related to downregulated proteins in MU compared to WT. I KEGG terms associated with upregulated proteins in MU vs. WT. Enrichments are reported as false discovery rates (FDR) ≤ 0.05. The twenty most enriched pathways are represented

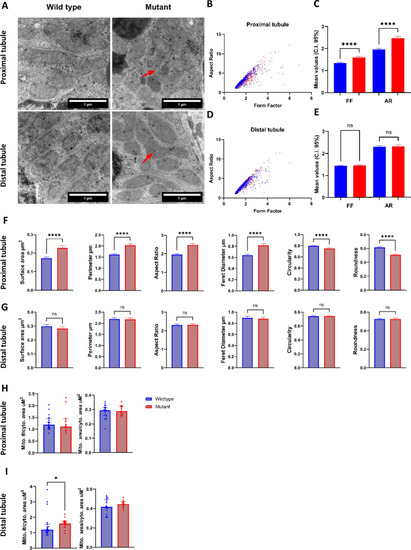
Analysis of morphological parameters in wild-type and GLA-mutant mitochondria in cells from proximal and distal renal tubules. A Electron microscopy showing representative micrographs of mitochondria (red arrows) in cells from wild-type and mutant proximal and distal tubules; B Mitochondrial form factor and aspect ratio plotted against each other in proximal tubule; C Statistical comparison using mean with 95% confidence intervals (CI) for form factor and aspect ratios in mitochondria from proximal tubule cells; D Mitochondrial form factor and aspect ratio plotted against each other in distal tubule; E Statistical comparison using mean and 95% confidence intervals (CI) for form factor and aspect ratios in mitochondria from distal tubule cells; F, G Mitochondrial morphological parameters comparison in proximal tubules and distal tubules; H, I Mitochondrial volume and density determination in proximal and distal tubules. Values are represented as mean with upper 95% CI. Data were analyzed using Mann–Whitney test. *p-value ≤ 0.05; ****p-value ≤ 0.00001; ns = non-significant

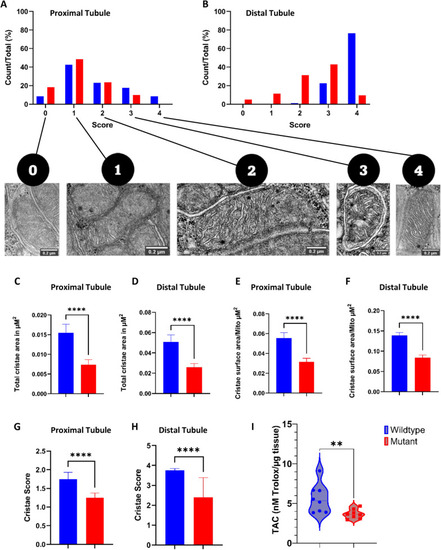
Mitochondrial cristae morphology and area determination in proximal and distal tubules performed using TEM images and total antioxidant determination (TAC) in wild-type and GLA-mutant Zebrafish. A, B Individual score grades across the whole mitochondrial population analyzed in cells from renal proximal and distal tubules; C, D Total cristae area in cells from proximal and distal tubules; E, F Cristae volume in proximal and distal renal tubules; G, H Cumulative cristae mean scores for proximal and distal renal tubules, I TAC levels in adult (9-months-old) zebrafish kidney tissue lysates. For mitochondria cristae morphology quantification data represented as mean with upper 95% confidence interval. For TAC values are represented as violin plot representing the median and IQ ranges. Data were analyzed using Mann–Whitney test; ****p-value ≤ 0.00001; **p-value ≤ 0.001

Immunohistochemical analysis of the expression of selected proteins in wild-type and mutant zebrafish renal tissues. A Representative image of IHC analysis targeting mitochondrial marker Sod2 and lysosomal marker Cd63 in kidneys from wild-type and mutant ZF renal tissues; B Quantification of immunohistochemical staining of sections from wild-type and mutant ZF kidneys. Signal intensity is significantly higher in wild-type than in mutant specimens for CD63 and Sod2; C Heatmap showing protein expression of CD63) and Sod2 in mutant and wild-type kidney tissues, normalized as percent of positive pixels. Data analysis using Mann–Whitney test; **p-value ≤ 0.001

EXPRESSION / LABELING:
Antibodies:
Fish:
Anatomical Term:
Stage: Adult
PHENOTYPE:
Fish:
Observed In:
Stage: Adult
Acknowledgments
This image is the copyrighted work of the attributed author or publisher, and ZFIN has permission only to display this image to its users. Additional permissions should be obtained from the applicable author or publisher of the image. Full text @ J Transl Med