|
Fig. 1
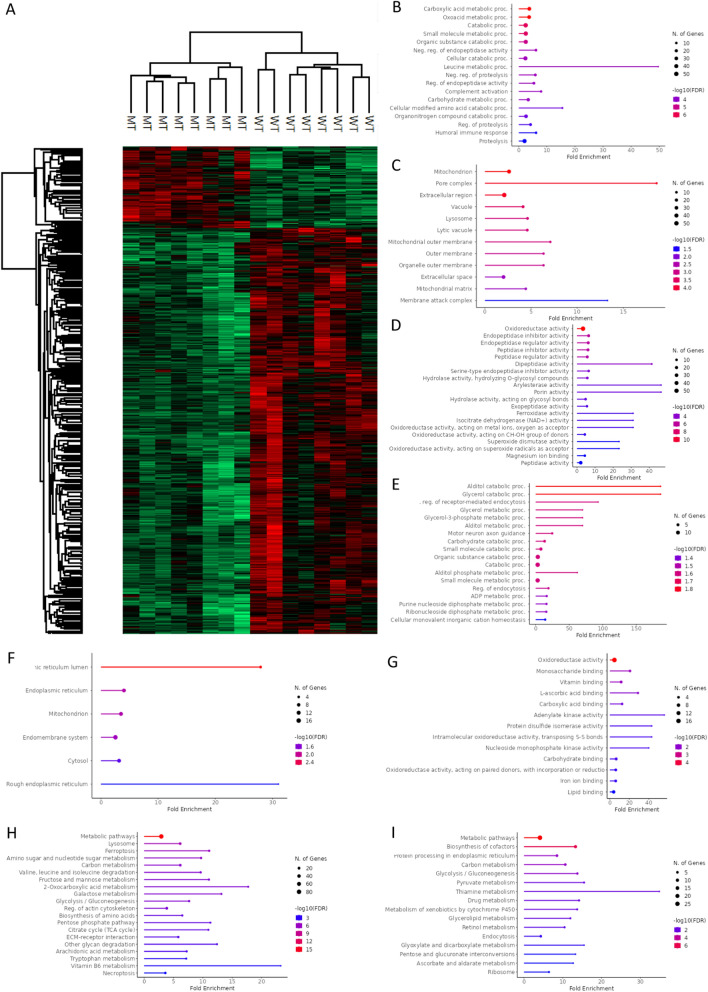
Proteomic comparison of kidneys from wild-type (WT; n = 8) and mutant (MU; n = 8) zebrafish. Gene ontology (GO) enrichment analysis and KEGG analysis.

|
|
Fig. 1
Proteomic comparison of kidneys from wild-type (WT; n = 8) and mutant (MU; n = 8) zebrafish. Gene ontology (GO) enrichment analysis and KEGG analysis.