FIGURE

Fig. 3

ID
ZDB-FIG-230916-290
Publication
Elsaid et al., 2023 - Proteomic analysis unveils Gb3-independent alterations and mitochondrial dysfunction in a gla-/- zebrafish model of Fabry disease
Other Figures
All Figure Page
Back to All Figure Page
Fig. 3

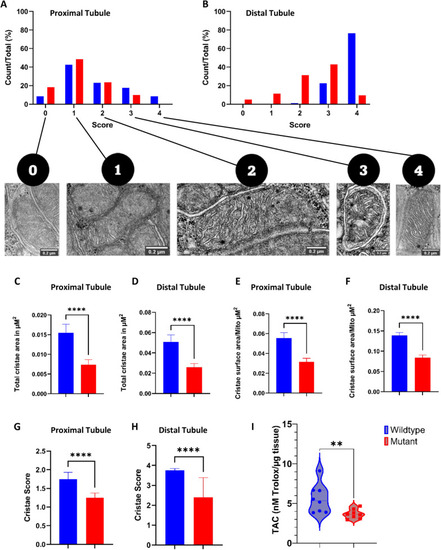
Mitochondrial cristae morphology and area determination in proximal and distal tubules performed using TEM images and total antioxidant determination (TAC) in wild-type and GLA-mutant Zebrafish. A, B Individual score grades across the whole mitochondrial population analyzed in cells from renal proximal and distal tubules; C, D Total cristae area in cells from proximal and distal tubules; E, F Cristae volume in proximal and distal renal tubules; G, H Cumulative cristae mean scores for proximal and distal renal tubules, I TAC levels in adult (9-months-old) zebrafish kidney tissue lysates. For mitochondria cristae morphology quantification data represented as mean with upper 95% confidence interval. For TAC values are represented as violin plot representing the median and IQ ranges. Data were analyzed using Mann–Whitney test; ****p-value ≤ 0.00001; **p-value ≤ 0.001

Expression Data

Expression Detail
Antibody Labeling
Phenotype Data
Fish:
Observed In:
Stage: Adult

Phenotype Detail
Acknowledgments
This image is the copyrighted work of the attributed author or publisher, and ZFIN has permission only to display this image to its users. Additional permissions should be obtained from the applicable author or publisher of the image. Full text @ J Transl Med