- Title
-
Expression of SATB1 and SATB2 in the brain of bony fishes: what fish reveal about evolution
- Authors
- Lozano, D., Lˇpez, J.M., JimÚnez, S., Morona, R., RuÝz, V., MartÝnez, A., Moreno, N.
- Source
- Full text @ Brain Struct. Funct.
|
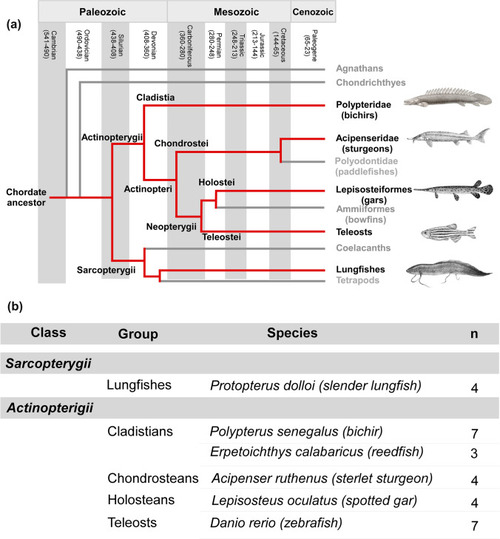
A Cladogram showing the phylogenetic relationships of the four major groups of vertebrates: agnathans, chondrichthyans (cartilaginous fishes), actinopterygians (ray-finned fishes), and the sarcopterygian radiation of lobe-finned fishes. B Number of animals (n) and species used in the present study. The fishes were purchased from the authorized commercial supplier PezyCia (Madrid, Spain) |
|
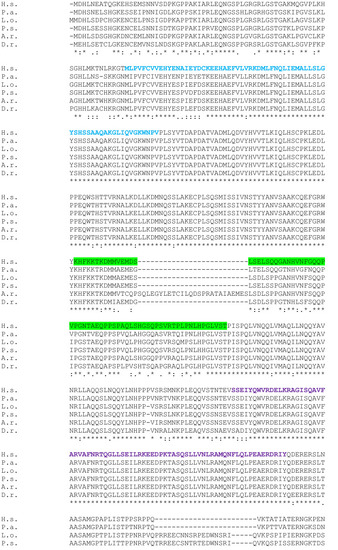
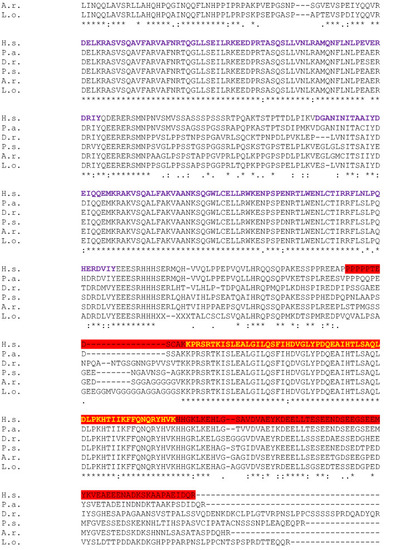
Full-length SATB1 protein sequence alignment in Homo sapiens (H.s) as a query, and Protopterus annectens (P.a), Lepisosteus oculatus (L.o), Danio rerio (D.r), Acipenser ruthenus (A.r) and Polypterus senegalus (P.s) using CLUSTALW. Identical amino acids are shown with an asterisk (*). The colon (:) and the dot (.) indicate a conserved substitution, and a semi-conserved substitution respectively. The SATB domain is shown in blue, the CUT domains are shown in purple and the homeodomain in yellow. The epitope sequence recognized by the Satb1/2 antibody (Abcam. Catalog reference ab51502) is underlined in red and the epitope sequence recognized by the Satb1 antibody (Santa Cruz Biotechnology. Catalog reference sc-376096) is underlined in green |
|
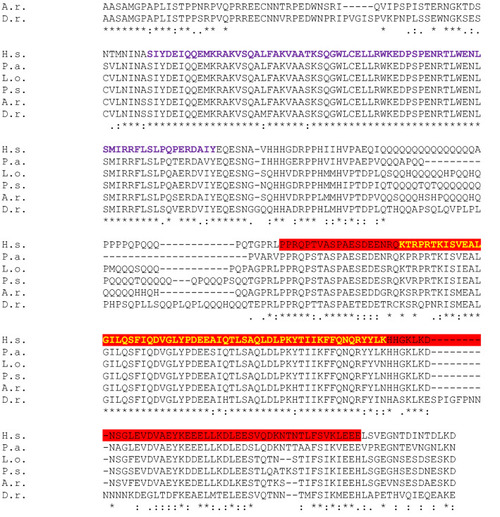
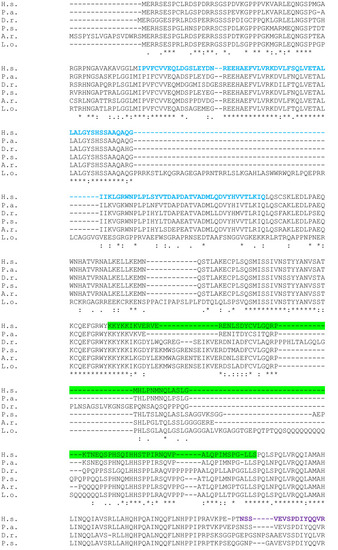
Full-length SATB2 protein sequence alignment in Homo sapiens (H.s) as a query, and Protopterus annectens (P.a), Lepisosteus oculatus (L.o), Danio rerio (D.r), Acipenser ruthenus (A.r) and Polypterus senegalus (P.s) using CLUSTALW. Identical amino acids are shown with an asterisk (*). The colon (:) and the dot (.) indicate a conserved substitution, and a semi-conserved substitution respectively. The SATB domain is shown in blue, the CUT domain is shown in purple and the homeodomain in yellow. The epitope sequence recognized by the Satb1/2 antibody (Abcam. Catalog reference ab51502) is underlined in red and the epitope sequence recognized by the Satb1 antibody (Santa Cruz Biotechnology. Catalog reference sc-376096) is underlined in green |
|
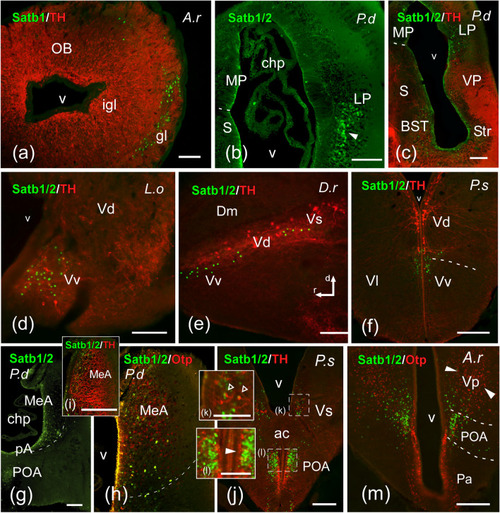
Photomicrographs of transverse (a?d, f?m) or sagittal (e) double-labeled sections through telencephalic areas of Protopterus dolloi (P.d), Danio rerio (D.r), Lepisosteus oculatus (L.o), Polypterus senegalus (P.s), and Acipenser ruthenus (A.r), showing the location of SATB1/2 (green color) alone or in combination with Otp or TH (red color) immunoreactivity. The markers and the species are indicated in each image. In the sagittal section the rostrocaudal and dorsoventral axis are indicated by arrows. a SATB1-ir cells in the glomerular layer of the olfactory bulb of A. ruthenus. b, c SATB1/2-ir cells in the pallium and subpallium of P. dolloi. d?f Subpallial derivatives of actinopterygian fishes labeled for SATB1/2. g?i The medial amygdala in P. dolloi, labeled for SATB1/2. j?m Caudal subpallial areas and the preoptic area, showing SATB1/2 immunoreactivity; empty arrowheads in (k) point to double labeled cells, white arrowheads in (l) and (m) point to TH-ir cells in POA and Otp-ir cells in Vp respectively. For abbreviations, see list. Scale bar: a, b, e, f = 200 Ám; c, d, g = 100 Ám EXPRESSION / LABELING:
|
|
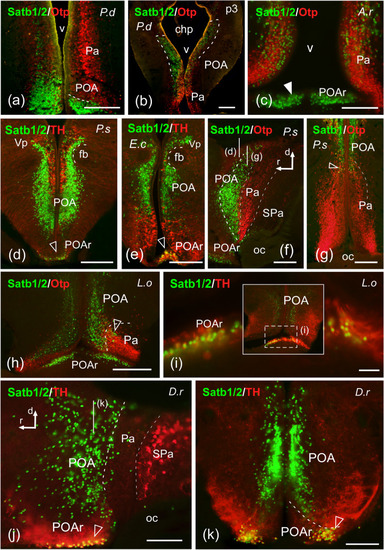
Photomicrographs of transverse (a?e, f?i, k) and sagittal (f, j) double-labeled sections of the preoptic area of Protopterus dolloi (P.d), Erpetoichthys calabaricus (E.c), Danio rerio (D.r), Lepisosteus oculatus (L.o), and Polypterus senegalus (P.s) showing the location of SATB1/2 or SATB1 (green color) alone or in combination with Otp or TH (red color) immunoreactivity. The markers and the species are indicated in each image. In the sagittal sections the rostrocaudal and dorsoventral axis are indicated by arrows. a, b SATB1/2 labeling in the POA of lungfish. c SATB1/2-ir cells in the rostral portion of POA of A. ruthenus; white arrowhead points to SATB1/2-ir cells in POAr. d?f SATB1/2 immunoreactivity in the POA of cladistians; empty arrowheads in (d) and (e) point to cells also labeled for TH. g SATB1-ir cells in the POA of P. senegalus; empty arrowhead points to double labeled cells. h, i SATB1/2-ir cells in the POA of L. oculatus; empty arrowhead in (h) and (i) points to double labeled cells. j, k SATB1/2-labeled cells in the POA of D. rerio; the line in (j) marks the level of (k), empty arrowheads point to double labeled cells. For abbreviations, see list. Scale bars: = 200 Ám EXPRESSION / LABELING:
|
|
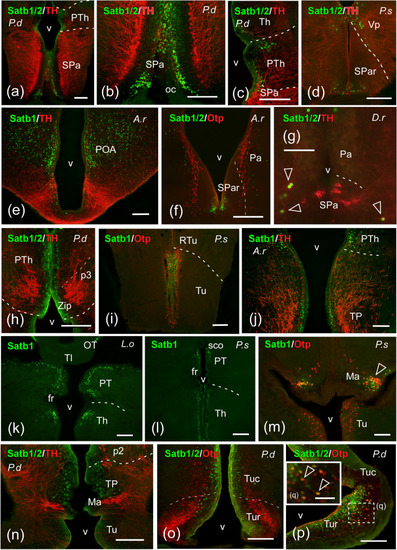
Photomicrographs of transverse double-labeled sections through hypothalamic and diencephalic areas of Protopterus dolloi (P.d), Polypterus senegalus (P.s), Acipenser ruthenus (A.r), Danio rerio (D.r), and Lepisosteus oculatus (L.o) showing the location of SATB1/2 or SATB1 (green color) alone or in combination with Otp or TH (red color) immunoreactivity. The markers and the species are indicated in each image. a?c SATB1/2 labeling in cells of the subparaventricular hypothalamic region (a, b) and the prethalamic and thalamic areas (c) of P. dolloi. d SATB1/2 cells in the rostral part of the subparaventricular region of P. senegalus. e, f Immunoreactive cell nuclei in the preoptic area and the subparaventricular region of A. ruthenus. g SATB1/2-ir cells in the subparaventricular region of D. rerio; empty arrowheads point to double labeled cells. h Labeled cells in the prethalamus within the alar prosomere 3 of the lungfish. i Tuberal hypothalamic region of P. senegalus showing SATB1-ir cells. j SATB1 labeling in the prethalamus and posterior tubercle of the sturgeon. k, l SATB1 immunoreactivity in cells of the thalamus and pretectum of L. oculatus (k) and P. senegalus (l). m SATB1-ir cells in the mamillary region of P. senegalus; empty arrowhead points to double labeled cells. n?q Labeled cells in the posterior tubercle (n) and the tuberal hypothalamic region (o?q) of the lungfish; empty arrowheads in q point to double labeled cells. For abbreviations, see list. Scale bar: a?k, n?t = 200 Ám; m, l = 100 Ám; u = 50 Ám EXPRESSION / LABELING:
|
|
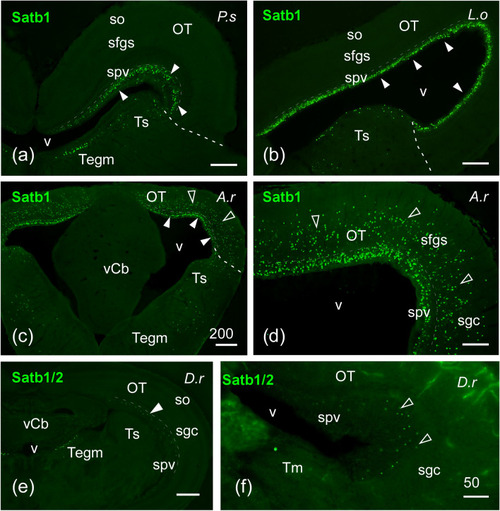
Photomicrographs of transverse single-labeled sections through mesencephalic areas of Polypterus senegalus (P.s), Lepisosteus oculatus (L.o), Acipenser ruthenus (A.r), and Danio rerio (D.r) showing the location of SATB1/2 or SATB1 immunoreactivity. The markers and the species are indicated in each image. a?f SATB1-ir cells in the periventricular layer of the optic tectum (spv), torus semicircularis and tegmentum of P. senegalus (a), L. oculatus (b), and A. ruthenus (c, d), the latter also with labeled cells in more superficial layers of the optic tectum; white arrowheads point to cells in spv, empty arrowheads in (c) and (d) point to cells in other tectal layers. e, f SATB1/2-ir cells in the optic tectum and tegmentum of D. rerio; arrowheads point to periventricular cells. For abbreviations, see list. Scale bars = 200 Ám (c), 100 Ám (a, b, d, e), 50 Ám (f) EXPRESSION / LABELING:
|
|
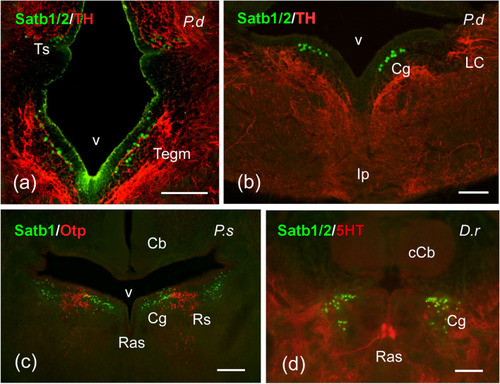
Photomicrographs of transverse single- and double-labeled sections through mesencephalic and rhombencephalic areas of Protopterus dolloi (P.d), Polypterus senegalus (P.s), and Danio rerio (D.r) showing the location of SATB1/2 or SATB1 (green color) alone or in combination with TH, Otp or 5-HT (red color) immunoreactivity. The markers and the species are indicated in each image. a, b SATB1/2-ir cells in the torus semicircularis and mesencephalic tegmentum (a), and in the central gray (b) of P. dolloi. c Populations of SATB1-ir cells in the central gray and superior reticular nucleus of P. senegalus. d SATB1/2-labeled cells in the central gray of D. rerio. For abbreviations, see list. Scale bars = 200 Ám (c), 100 Ám (a, b, d, e), 50 Ám (f) EXPRESSION / LABELING:
|
|
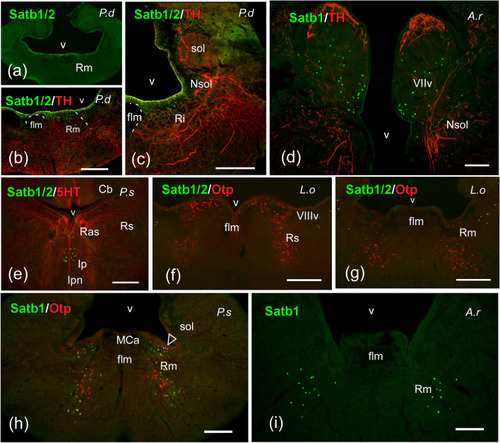
Photomicrographs of transverse single- and double-labeled sections through rhombencephalic areas of Protopterus dolloi (P.d), Acipenser ruthenus (A.r), Polypterus senegalus (P.s), and Lepisosteus oculatus (L.o) showing the location of SATB1/2 or SATB1 (green color) alone or in combination with TH, 5-HT or Otp (red color) immunoreactivity. The markers and the species are indicated in each image. a?c SATB1/2-ir cells in the reticular formation of P. dolloi. d Population of SATB1-ir cells in the facial lobe and solitary tract nucleus of A. ruthenus. e SATB1/2-ir cells in the interpeduncular nucleus of P. senegalus. f, g Populations of SATB1/2-ir cells in the ventral octavolateral area (f) and the median reticular nucleus (g) of L. oculatus. h, i Reticular cells labeled with SATB1 in P. senegalus (h) and A. ruthenus (i); arrowheads in (h) point to double labeled cells. For abbreviations, see list. Scale bars = 200 Ám (c), 100 Ám (a, b, d, e), 50 Ám (f) |
|
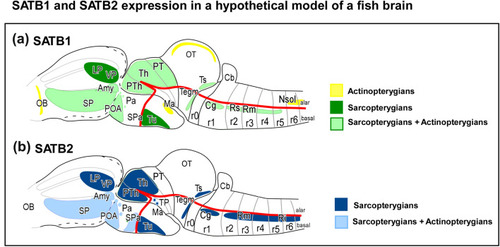
Schematic representation of SATB1 (A) and SATB2 (B) expression patterns in a model vertebrate. The schemes represent the main regions of expression found in the present study. The particular exceptions have not been included for simplicity but are detailed in the text and in Table ?Table3.3. The correspondence of the color code is indicated on the right. The anatomical representation does not correspond to any particular model. See list for abbreviations |

