Fig. 5
|
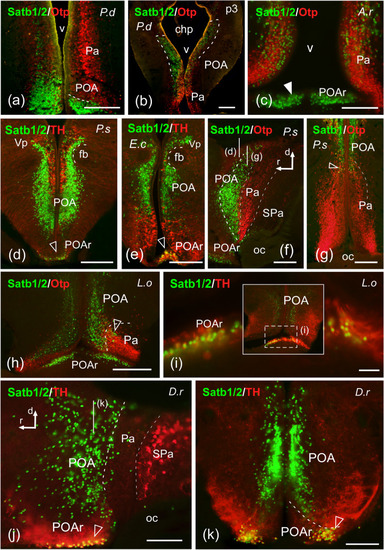
Photomicrographs of transverse (a?e, f?i, k) and sagittal (f, j) double-labeled sections of the preoptic area of Protopterus dolloi (P.d), Erpetoichthys calabaricus (E.c), Danio rerio (D.r), Lepisosteus oculatus (L.o), and Polypterus senegalus (P.s) showing the location of SATB1/2 or SATB1 (green color) alone or in combination with Otp or TH (red color) immunoreactivity. The markers and the species are indicated in each image. In the sagittal sections the rostrocaudal and dorsoventral axis are indicated by arrows. a, b SATB1/2 labeling in the POA of lungfish. c SATB1/2-ir cells in the rostral portion of POA of A. ruthenus; white arrowhead points to SATB1/2-ir cells in POAr. d?f SATB1/2 immunoreactivity in the POA of cladistians; empty arrowheads in (d) and (e) point to cells also labeled for TH. g SATB1-ir cells in the POA of P. senegalus; empty arrowhead points to double labeled cells. h, i SATB1/2-ir cells in the POA of L. oculatus; empty arrowhead in (h) and (i) points to double labeled cells. j, k SATB1/2-labeled cells in the POA of D. rerio; the line in (j) marks the level of (k), empty arrowheads point to double labeled cells. For abbreviations, see list. Scale bars: = 200 Ám |
| Antibody: | |
|---|---|
| Fish: | |
| Anatomical Term: | |
| Stage: | Adult |

