- Title
-
Regenerative potential and limitations in a zebrafish model of hyperglycemia-induced nerve degeneration
- Authors
- Sargent, S., Brennan, A., Clark, J.K.
- Source
- Full text @ Dev. Dyn.
|
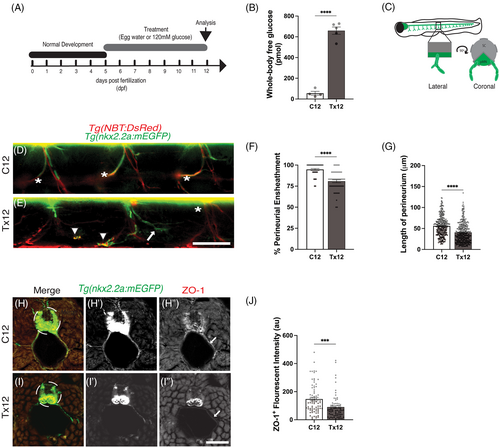
Acute hyperglycemia induces degeneration of the perineurial structure ensheathing the motor nerves. (A) A schematic outlining hyperglycemia-inducing treatment schedule. (B) Following the schedule of treatment described in (A), there was a significant increase in whole-body glucose levels in Tx12 fish compared to C12 fish, ****P < .0001. (C) Schematic representation of the orientations of lateral and coronal views of peripheral motor nerves. (D and E) Lateral view of C12 and Tx12 Tg(nkx2.2a:mEGFP);Tg(NBT:DsRed) zebrafish. Ensheathment of peripheral motor axons (red) by perineurial glia (green) appeared continuous along the length of the axons in C12 fish (D, asterisk). The perineurium in Tx12 fish often appeared disassociated from axons (E, arrow), absent (E, asterisk), or associated with debris (E, arrowhead). (F) The percentage of perineurial-ensheathed motor axons was significantly lower in Tx12 fish compared to C12 fish, ****P < .0001. (G) The length of perineurial-ensheathment was also significantly lower in Tx12 fish than C12 fish, ****P < .0001. (H and I) Representative images of C12 and Tx12 Tg(nkx2.2a:mEGFP) zebrafish antibody labeled against zonula occludens-1 (ZO-1, red). In C12 fish, ZO-1+ tight junctions were present along the length of the entire perineurium (H?, arrow), whereas in Tx12 fish, ZO-1+ tight junctions were diminished and discontinuous along the perineurium (I?, arrow). (J) ZO-1+ fluorescent intensity (standardized to nkx2.2a) was diminished in Tx12 fish compared to C12 fish, ****P < .0001 (au, arbitrary units). All values are means ± SEM. Scale bars = 50 ?m. |
|
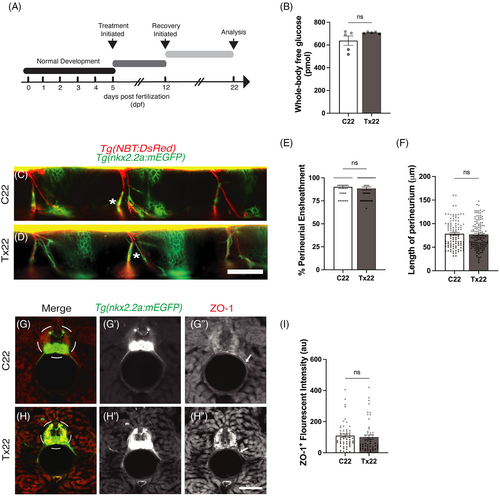
Regeneration of the perineurial structure ensheathing the motor nerves following recovery from acute hyperglycemia. (A) A schematic outlining the treatment and recovery schedule. (B) Following the schedule of treatment described in (A), there was no significant (ns) difference in whole-body glucose levels of Tx22 fish compared to C22 fish, P = .1284. (C and D) Lateral view of C22 and Tx22 Tg(nkx2.2a:mEGFP);Tg(NBT:DsRed) zebrafish. Following the recovery period, perineurial glia (green) were associated with peripheral motor axons (red) in both C22 (C, asterisk) and Tx22 (D, asterisk) fish. (E) The percentage of perineurial-ensheathed motor axons did not differ between Tx22 and C22 fish following recovery, P = .4730. (F) Similarly, no difference in the length of perineurial-ensheathment was observed between C22 and Tx22 fish following the recovery period, P = .6890. (G and H) Representative images of C22 and Tx22 Tg(nkx2.2a:mEGFP) zebrafish antibody labeled against ZO-1 (red). ZO-1+ tight junction proteins were continuous along the length of the perineurium in C22 fish (G?, arrow). ZO-1+ tight junction proteins also appeared to be continuous in Tx22 fish (H?, arrow). (I) ZO-1+ fluorescent intensity (standardized to nkx2.2a) was not significantly different between Tx22 and C22 fish, P = .8400 (au, arbitrary units). All values are means ± SEM. Scale bars = 50 ?m. |
|
Behavioral deficits remain following recovery from acute hyperglycemia. (A) Schematic describing an established touch response locomotor assay to examine escape response. Caudal fins of acclimated fish were taped until an escape response was elicited. (B) Following the treatment described in Figure 1A, a decrease in escape response was observed in Tx12 fish compared to C12, ***P = .0002. (C) Following the 10-day recovery period described in Figure 2A, decreased escape responses persisted in Tx22 fish compared to C22 fish, *P = .0171. All values are means ± SEM. |
|
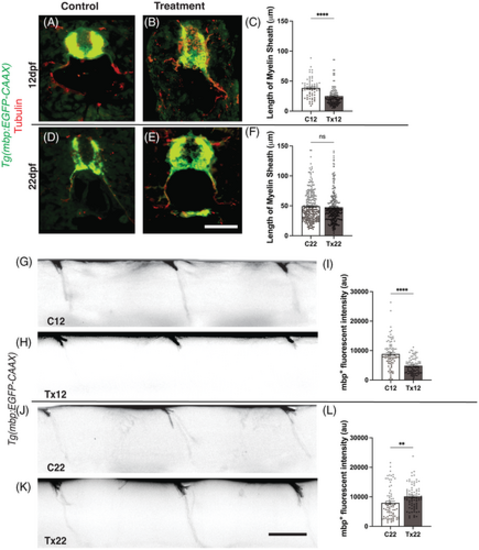
Regeneration of myelinated segments following recovery from acute hyperglycemia.(A & B) Representative images of C12 and Tx12 Tg(mbp:EGFP-CAAX) zebrafish labeled with antibodies against GFP (green) and acetylated ?-tubulin (red) following the treatment schedule described in Figure 1A. (C) The length of myelinated segments were significantly shorter in Tx12 fish compared to C12 fish, ****P < .0001. (D and E) Representative images of C22 and Tx22 Tg(mbp:EGFP-CAAX) zebrafish labeled with antibodies against GFP (green) and acetylated ?-tubulin (red) following the treatment and recovery schedule described in Figure 2A. (F) Following the 10-day recovery period, no difference was observed in the length of myelinated segments between Tx22 and C22 fish, P = .4413. (G and H) Lateral view of C12 and Tx12 myelinated segments. (I) 7-day incubation in 120 mM D-glucose solution significantly diminished mbp+ fluorescent intensity in Tx12 fish compared to C12, ****P < .0001. (J and K) Lateral view of C22 and Tx22 myelinated segments. (L) Following recovery, Tx22 myelinated segments had a significantly greater mbp+ fluorescent intensity compared to C22, **P = .0055. au, arbitrary units. All values are means ± SEM. Scale bars = 50 ?m. |
|
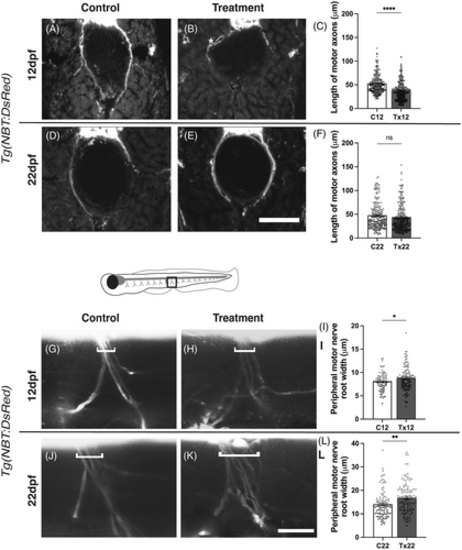
Regeneration of motor axons following recovery from acute hyperglycemia. (A and B) Coronal sections of Tg(NBT:DsRed) zebrafish following the treatment schedule described in Figure 1A |
|
Myofibril organization deficits diminish following recovery from hyperglycemia. Lateral view of whole-mount 12 and 22 dpf fish trunk skeletal muscle labeled for myosin with F59 to visualize myofibril organization before and after recovery from hyperglycemia. (A and B) Subtle deficits in myofibril organization following hyperglycemia was consistently observed in Tx12 fish compared to C12 fish. (C and D) Following recovery, myofibril organization of Tx22 fish appeared similar to C22 fish. All values are means ± SEM. Scale bar = 50 ?m. |
|
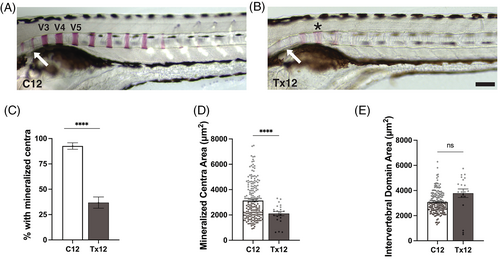
Acute hyperglycemia impairs vertebral mineralization. (A and B) Lateral view of C12 and Tx12 zebrafish stained with alizarin red solution. Mineralization of vertebrae occurs anterior to posteriorly with vertebrae 3 to 5 (V3-5) mineralizing first. Mineralization of vertebrae in C12 fish (A) progressed further posteriorly than Tx12 fish (B). C12 fish also have begun mineralization of vertebrae 1 and 2, which occurs after a sufficient amount of the vertebral column is mineralized (A, arrow). Tx12 fish with mineralized vertebrae have lighter alizarin red staining in V3-5 (B, asterisk) and even fainter staining of vertebrae 1 and 2 (B, arrow). (C) Tx12 fish were significantly less likely to have any mineralized centra present compared to C12 fish, ****P < .0001. (D) Mineralized V3-5 that were present in Tx12 fish had significantly reduced areas compared to C12, ****P < .0001. (E) The area of intervertebral domain (IVD) adjacent to V3-5 were not different between Tx12 and C12 fish as this time point is earlier than stages of vertebral development in which the centra expand into the IVD, P = .0563. All values are means ± SEM. Scale bar = 100 ?m. |
|
Impairment of vertebral development persists following recovery from acute hyperglycemia. (A and B) Lateral view of C22 and Tx22 zebrafish stained with alizarin red solution; robust differences are observed in terms of mineralization of centra, development of neural arches (na; extending dorsally from the centra) and hemal arches (ha; extending ventrally from the centra), and mineralization of the anal fin rays (A and B, arrows) between C22 and Tx22 zebrafish. Tx22 fish continued to exhibit statistically significant reductions in the area of mineralized centra (V3-5) and increased intervertebral domain (IVD) area compared to C22 fish, and these differences were significant (?All? bars in C and D, respectively, ****P < .0001). (C) This difference in centra area persisted when Tx22 and C22 fish were size matched by total body length (TL): 4 mm, ****P < .0001; 5 mm, ****P < .0001, 6 mm, ***P = .0003. No analyses were conducted at 7 and 8 mm TL as there were no Tx22 of this size. (D) Likewise, the difference in IVD area persisted when Tx22 and C22 were size matched by TL: 4 mm, **P = .0029; 5 mm, ****P < .0001; 6 mm, ***P = .0004. (E) Tx22 fish were significantly less likely to have neural arches present anywhere along their axial skeleton compared to C22 fish, ****P < .0001. (F) A significant absence of hemal arches in Tx22 fish was also observed, ****P < .0001. (G) Mineralization of skeletal structures within the caudal fin were also observed in C22 fish. (H) Mineralization of the caudal vertebrae and fin rays were absent in Tx22 fish. All values are means ± SEM (see Table 1). Scale bars = 200 ?m. |

