
Fig. 4
- ID
- ZDB-FIG-231102-33
- Publication
- Sargent et al., 2023 - Regenerative potential and limitations in a zebrafish model of hyperglycemia-induced nerve degeneration
- Other Figures
- All Figure Page
- Back to All Figure Page
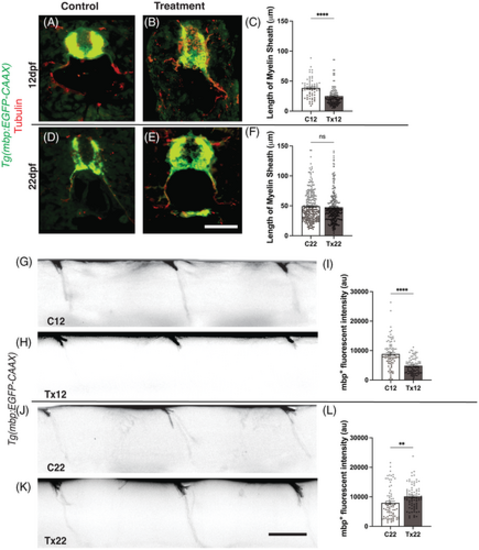
Regeneration of myelinated segments following recovery from acute hyperglycemia.(A & B) Representative images of C12 and Tx12 Tg(mbp:EGFP-CAAX) zebrafish labeled with antibodies against GFP (green) and acetylated ?-tubulin (red) following the treatment schedule described in Figure 1A. (C) The length of myelinated segments were significantly shorter in Tx12 fish compared to C12 fish, ****P < .0001. (D and E) Representative images of C22 and Tx22 Tg(mbp:EGFP-CAAX) zebrafish labeled with antibodies against GFP (green) and acetylated ?-tubulin (red) following the treatment and recovery schedule described in Figure 2A. (F) Following the 10-day recovery period, no difference was observed in the length of myelinated segments between Tx22 and C22 fish, P = .4413. (G and H) Lateral view of C12 and Tx12 myelinated segments. (I) 7-day incubation in 120 mM D-glucose solution significantly diminished mbp+ fluorescent intensity in Tx12 fish compared to C12, ****P < .0001. (J and K) Lateral view of C22 and Tx22 myelinated segments. (L) Following recovery, Tx22 myelinated segments had a significantly greater mbp+ fluorescent intensity compared to C22, **P = .0055. au, arbitrary units. All values are means � SEM. Scale bars = 50 ?m. |