
- Title
-
Expression Profiles of Zebrafish (Danio rerio) Lysozymes and Preparation of c-Type Lysozyme with High Bacteriolytic Activity against Vibrio vulnificus
- Authors
- Chen, H., Chen, X., Song, T.Y., Ge, J.Q.
- Source
- Full text @ Antibiotics (Basel)
|
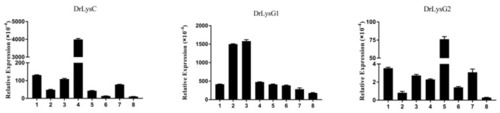
Constitutive expression of DrLysC, DrLysG1, and DrLysG2 in different tissues of zebrafish. Total RNA of different tissues of zebrafish was extracted for qPCR analysis. Relative expression of DrLysC, DrLysG1, and DrLysG2 was calculated using the 2???Ct method, and ?-actin was used as internal control. 1, heart; 2, liver; 3, spleen; 4, kidney; 5, gill; 6, intestine; 7, muscle; 8, skin. |
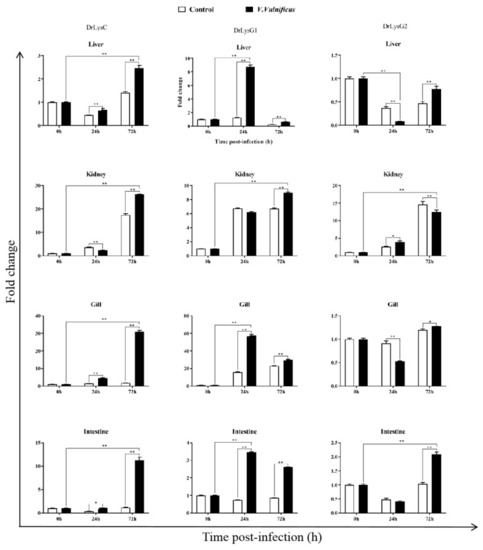
The expression of DrLysC, DrLysG1, and DrLysG2 in different tissues of V. vulnificus-infected zebrafish. Tissues of V. vulnificus-infected zebrafishes were collected at 0, 24, and 72 h post injection, and total RNA was extracted for qPCR analysis. Relative expression of DrLysC, DrLysG1, and DrLysG2 was calculated using the 2???Ct method, and data are expressed as fold-change values. Each sample was tested in triplicate, and all data are presented as means � SD. Statistical analysis was determined using two-way ANOVA for multiple comparisons. ** indicates highly significant differences (p < 0.001); * indicates significant differences (p < 0.05). |
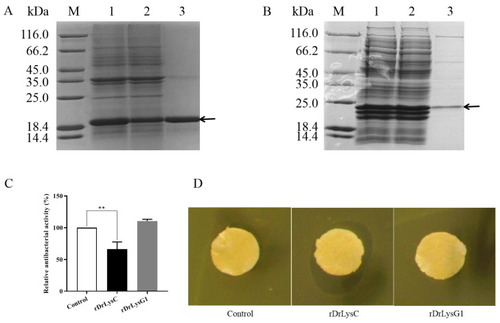
Expression and antimicrobial activity determination of rDrLysC and rDrLysG1. (A) Expression and purification of rDrLysC. M, protein marker; 1, induced bacterial lysate of pET-DrLysC/BL21; 2, residue of induced bacteria lysate of pET-DrLysC/BL21 after purification; 3, purified rDrLysC. (B) Expression and purification of rDrLysG1. M, protein marker; 1, induced bacterial lysate of pET-DrLysG1/BL21; 2, residue of induced bacteria lysate of pET-DrLysG1/BL21 after purification; 3, purified rDrLysG1. (C) Determination of the antimicrobial activity of the purified rDrLysC and rDrLysG1 against V. vulnificus. Relative antibacterial activity of the purified rDrLysC and rDrLysG1 were calculated using normal cultured V. vulnificus as control, and all samples were tested in triplicates. ** indicates highly significant differences. (D) Inhibition zones of the purified rDrLysC and rDrLysG1 against V. vulnificus strain FJ03-X2. The sterile filter paper containing 10 ?g of rDrLysC or rDrLysG1, respectively, was evenly pasted on the plate, and filter paper containing sterile water was used as control. The plates were incubated at 28 �C overnight, then the inhibition zone was observed and photographed. |