
Image
|
Figure Caption
Figure 2
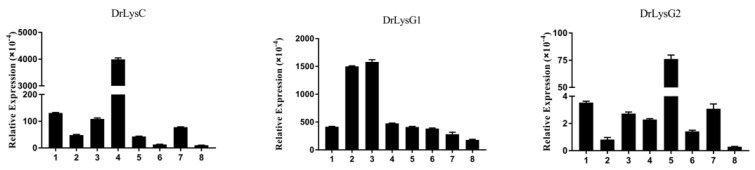
Constitutive expression of DrLysC, DrLysG1, and DrLysG2 in different tissues of zebrafish. Total RNA of different tissues of zebrafish was extracted for qPCR analysis. Relative expression of DrLysC, DrLysG1, and DrLysG2 was calculated using the 2???Ct method, and ?-actin was used as internal control. 1, heart; 2, liver; 3, spleen; 4, kidney; 5, gill; 6, intestine; 7, muscle; 8, skin.
Figure Data
Acknowledgments
This image is the copyrighted work of the attributed author or publisher, and
ZFIN has permission only to display this image to its users.
Additional permissions should be obtained from the applicable author or publisher of the image.
Full text @ Antibiotics (Basel)