
|
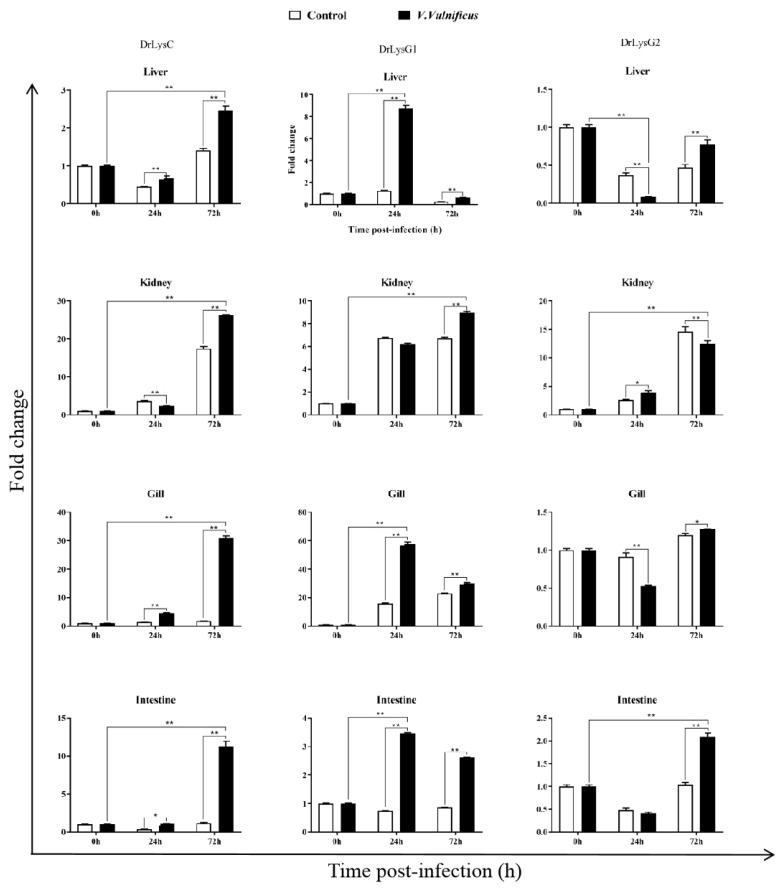
Figure 3
The expression of DrLysC, DrLysG1, and DrLysG2 in different tissues of V. vulnificus-infected zebrafish. Tissues of V. vulnificus-infected zebrafishes were collected at 0, 24, and 72 h post injection, and total RNA was extracted for qPCR analysis. Relative expression of DrLysC, DrLysG1, and DrLysG2 was calculated using the 2???Ct method, and data are expressed as fold-change values. Each sample was tested in triplicate, and all data are presented as means � SD. Statistical analysis was determined using two-way ANOVA for multiple comparisons. ** indicates highly significant differences (p < 0.001); * indicates significant differences (p < 0.05).