- Title
-
Leukocyte invasion of the brain after peripheral trauma in zebrafish (Danio rerio)
- Authors
- Chen, X.K., Kwan, J.S., Wong, G.T., Yi, Z.N., Ma, A.C., Chang, R.C.
- Source
- Full text @ Exp. Mol. Med.
|
a Experimental setup. dpf, day post-fertilization. b?d Light-sheet imaging showed a significantly increased number of coro1a?+?leukocytes in the zebrafish whole brain/midbrain and forebrain with peripheral trauma (PT) at 1 day post-trauma (dpt) but not at 2 dpt compared with the control (CTRL). Independent t test, **, p?<?0.01. Scale bar, 40?Ám (whole brain), 20?Ám (forebrain). f forebrain. m, midbrain. h, hindbrain. Asterisk, autofluorescence of pigment. e?f Phospho-histone H3 (PH3) staining indicated no difference in the number of cells in mitosis in the brain between CTRL and PT. Independent t test. Scale bar, 20?Ám. g, h qPCR but not light-sheet imaging showed significantly increased expression or the number of mpx1?+?neutrophils in the head at 1 dpt. Independent t test, **, p?<?0.01. Scale bar, 40?Ám. Asterisk, autofluorescence of pigment. i?j Light-sheet imaging and qPCR showed significantly increased expression or the number of mepg1?+?macrophages in the head at 1 dpt. Independent t test, **, p?<?0.01. Scale bar, 40?Ám. k Flow cytometry detected an increased number of mepg1?+?macrophages in the head after peripheral trauma. (l) No difference in rag1?+?lymphocytes (red arrow) was found in whole-mount in situ hybridization (WISH) between CTRL and PT. Scale bar, 40?Ám. m qPCR showed significantly increased expression of lcp1?+?leukocytes in the head after peripheral trauma. Independent t test, **, p?<?0.01. n Experimental setup for dendra2 photoconversion and peripheral leukocyte tracking. o?p A significantly elevated number of photoconverted magenta+ leukocytes (white arrow) in the brains of zebrafish after peripheral trauma. Independent t test, **, p?<?0.01. Scale bar, 40?Ám. |
|
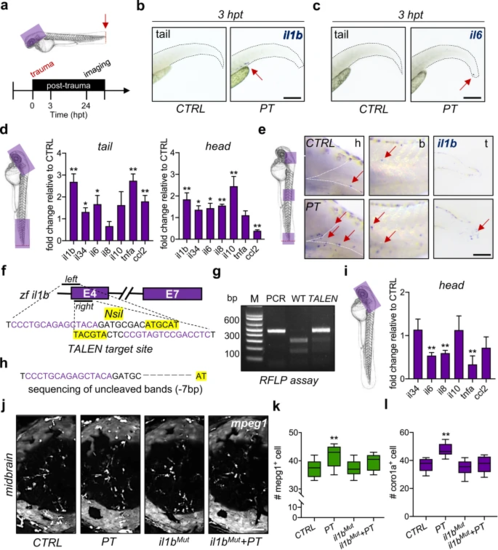
a Experimental setup. hpt, hours post-trauma. b, c The expression of il1b?+?and il6?+?cells (red arrow) in zebrafish larvae was measured by WISH at 3 hpt. Scale bar, 200?Ám. d qPCR showed that the mRNA levels of various cytokines or chemokines changed in the traumatic site/tail and the brain/head compared to CTRL. Independent t test, *, p?<?0.05, **, p?<?0.01. e WISH showed increased il1b?+?cells (red arrow) in the brain/head, body/trunk, and traumatic site/tail of zebrafish larvae at 24 hpt. Scale bar, 100?Ám. h, head. b, body. t, tail. f Design of the transcription activator-like effector nucleases (TALEN) targeting zebrafish il1b. g, h il1b mutation (il1bMut) was confirmed by the restriction fragment length polymorphism (RFLP) assay and Sanger sequencing (?7 bp). (i) qPCR showed that the mRNA levels of various cytokines were decreased in il1bMut zebrafish brains compared to CTRL brains. Independent t test, **, p?<?0.01. j?l il1bMut rescued the increased mpeg1?+?macrophages or coro1a?+?leukocytes in the zebrafish brain at 24 hpt. Two-way ANOVA with Tukey?s HSD post hoc test, **, p?<?0.01 compared to CTRL. Scale bar, 40?Ám. |
|
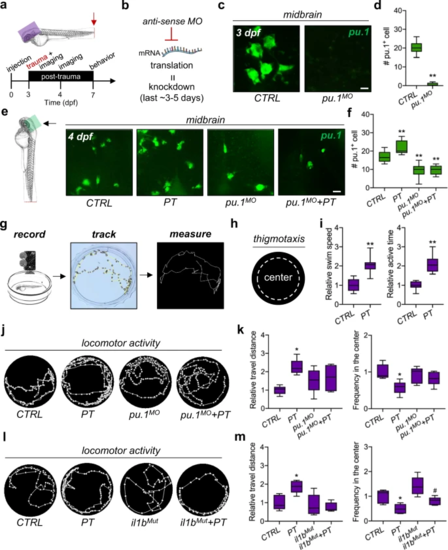
a Experimental setup. b Schematic showing antisense morpholino (MO)-mediated transient knockdown. c, d Light-sheet imaging showed a significantly decreased number of pu.1?+?myeloid cells by pu.1 MO knockdown in the zebrafish brain at 3 dpf. Independent t test, **, p?<?0.01. Scale bar, 10?Ám. e, f Light-sheet imaging showed that pu.1 MO knockdown inhibited the increase in pu.1?+?myeloid cells in the zebrafish brain at 1 dpt. Two-way ANOVA with Tukey?s HSD post hoc test, **, p?<?0.01 compared with CTRL. Scale bar, 20?Ám. g, h Schematic showing the locomotor behavioral assay and thigmotaxis for zebrafish larvae. i Peripheral trauma increased the swim speed and active time of zebrafish larvae at 7 dpf/4 dpt. Independent t test, **, p?<?0.01. j?k Behavioral assays suggested anxiety-like behaviors, including hyperactivity and thigmotaxis, in zebrafish at 4 dpi, which could be rescued by pu.1 MO knockdown. Two-way ANOVA with Tukey?s HSD post hoc test, *, p?<?0.05 compared with CTRL. l?m il1b mutation rescued hyperactivity but not thigmotaxis at 4 dpi. Two-way ANOVA with Tukey?s HSD post hoc test, *, p?<?0.05 compared to CTRL, #, p?<?0.05 compared to il1bMut. EXPRESSION / LABELING:
PHENOTYPE:
|
|
a Experimental setup. b Active leukocytes (white arrow) were distributed in the brains of zebrafish with or without peripheral trauma. Scale bar, 40?Ám. c Time-lapse light-sheet imaging showed the active leukocytes (red arrow) around the zebrafish brain in CTRL. Scale bar, 20?Ám. d Time-lapse light-sheet imaging showed active leukocytes (red arrow) around the brain (1), inside the brain (2), and invading the brain (3) at 4 dpf. Scale bar, 20?Ám. e Time-lapse light-sheet imaging showed the active leukocytes (red arrow) around the brain in il1bMut zebrafish. Scale bar, 20?Ám. f Time-lapse light-sheet imaging showed the active leukocytes (red arrow) around the brain in il1bMut zebrafish at 4 dpf. Scale bar, 20?Ám. PHENOTYPE:
|
|
a Experimental setup. b, d Light-sheet imaging showed an increased number and percentage of the colocalization of coro1a?+?leukocytes and AO?+?apoptotic cells in the zebrafish brain at 4 dpt. Independent t test, **, p?<?0.01 compared with CTRL. c, e Light-sheet imaging showed an increased number of AO?+?apoptotic cells in the zebrafish brain at 1 dpt but not at 2 dpt. Independent t test, **, p?<?0.01 compared to CTRL. f Light-sheet imaging showed that mpeg1?+?macrophages returned to the CHT at 2 dpt. Two-way ANOVA with Tukey?s HSD post hoc test, **, p?<?0.01 compared to CTRL at 1 dpt, #, p?<?0.05 compared to CTRL at 2 dpt. Scale bar, 5?Ám. g Schematic showing that apoptosis in the brain is associated with leukocyte distribution. h?k il1b mutation rescued the increased number of AO?+?or TUNEL?+?apoptotic cells in the zebrafish brain at 1 dpi. Two-way ANOVA with Tukey?s HSD post hoc test, **, p?<?0.01 compared to CTRL. Scale bar, 40?Ám. PHENOTYPE:
|
|
a, b Time-lapse light-sheet imaging showed the phagocytosis of AOhigh and AOlow cells (white arrow or arrowhead) by coro1a?+?leukocytes in the zebrafish brain at 1 dpt. c, d Neutral red staining showed microglial lysosome impairment in zebrafish brains with or without il1b mutation at 1 dpt. Two-way ANOVA with Tukey?s HSD post hoc test, **, p?<?0.01 compared to CTRL. Scale bar, 40?Ám. e, f LysoTracker staining showed mpeg1?+?microglial lysosome impairment in the zebrafish brain at 1 dpt or under il1b mutation. Two-way ANOVA with Tukey?s HSD post hoc test, **, p?<?0.01 compared to CTRL. Scale bar, 20?Ám. PHENOTYPE:
|
|
a Experimental setup. b Schematic showing the proteomic analysis in the head region of zebrafish larvae after peripheral trauma. MS, mass spectrometry. c Heatmap illustrating the fold change in proteins among the CTRL, PT, il1bMut, and il1bMut?+?PT groups. d The volcano plot illustrates the proteins that were significantly (p?<?0.05) changed (>1.5-fold) in the head region of zebrafish after peripheral trauma and the change in these identified proteins (purple) in various conditions: (1) PT/CTRL, (2) il1bMut?+?PT/CTRL, and (3) il1bMut?+?PT/il1bMut. n, the number of identified proteins that significantly increased. e The relative levels of proteins in the CTRL, CTRL?+?PT, il1bMut, and il1bMut?+?PT groups. Two-way ANOVA with Tukey?s HSD post hoc test, *, p?<?0.05, **, p?<?0.01 compared with CTRL. |
|
Schematic diagram of systemic inflammation-mediated leukocyte invasion and its impacts on the brain after peripheral trauma. |


