
Fig. 7
|
Fig. 7
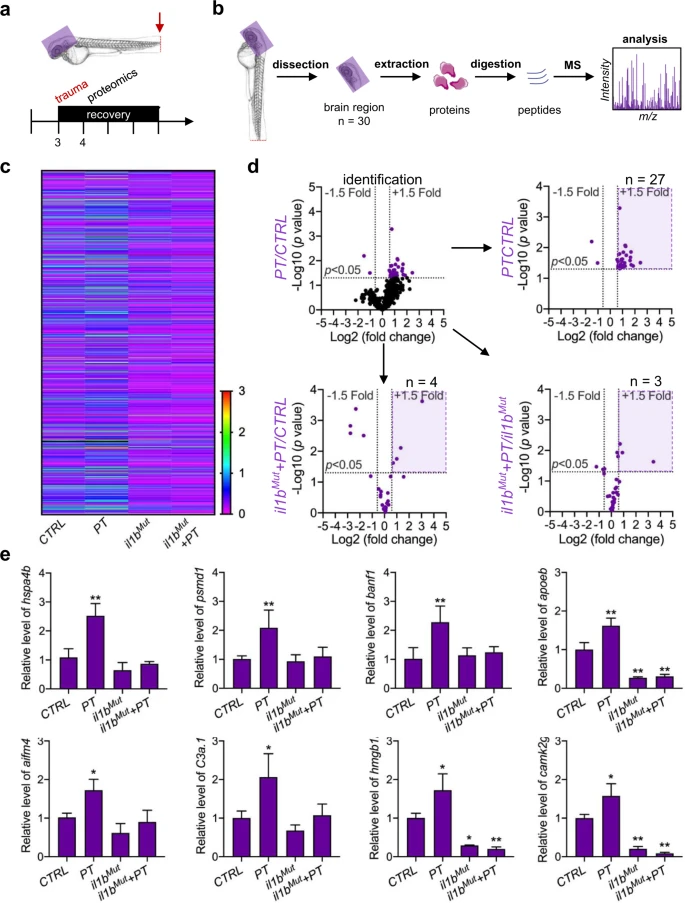
a Experimental setup. b Schematic showing the proteomic analysis in the head region of zebrafish larvae after peripheral trauma. MS, mass spectrometry. c Heatmap illustrating the fold change in proteins among the CTRL, PT, il1bMut, and il1bMut?+?PT groups. d The volcano plot illustrates the proteins that were significantly (p?<?0.05) changed (>1.5-fold) in the head region of zebrafish after peripheral trauma and the change in these identified proteins (purple) in various conditions: (1) PT/CTRL, (2) il1bMut?+?PT/CTRL, and (3) il1bMut?+?PT/il1bMut. n, the number of identified proteins that significantly increased. e The relative levels of proteins in the CTRL, CTRL?+?PT, il1bMut, and il1bMut?+?PT groups. Two-way ANOVA with Tukey?s HSD post hoc test, *, p?<?0.05, **, p?<?0.01 compared with CTRL.