
Fig. 1
|
Fig. 1
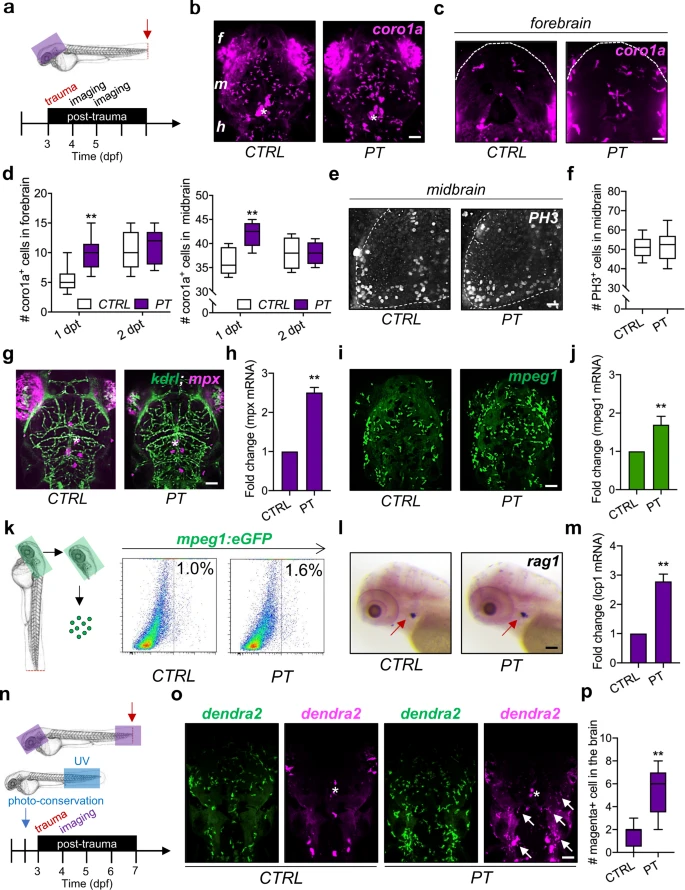
a Experimental setup. dpf, day post-fertilization. b–d Light-sheet imaging showed a significantly increased number of coro1a + leukocytes in the zebrafish whole brain/midbrain and forebrain with peripheral trauma (PT) at 1 day post-trauma (dpt) but not at 2 dpt compared with the control (CTRL). Independent t test, **, p < 0.01. Scale bar, 40 µm (whole brain), 20 µm (forebrain). f forebrain. m, midbrain. h, hindbrain. Asterisk, autofluorescence of pigment. e–f Phospho-histone H3 (PH3) staining indicated no difference in the number of cells in mitosis in the brain between CTRL and PT. Independent t test. Scale bar, 20 µm. g, h qPCR but not light-sheet imaging showed significantly increased expression or the number of mpx1 + neutrophils in the head at 1 dpt. Independent t test, **, p < 0.01. Scale bar, 40 µm. Asterisk, autofluorescence of pigment. i–j Light-sheet imaging and qPCR showed significantly increased expression or the number of mepg1 + macrophages in the head at 1 dpt. Independent t test, **, p < 0.01. Scale bar, 40 µm. k Flow cytometry detected an increased number of mepg1 + macrophages in the head after peripheral trauma. (l) No difference in rag1 + lymphocytes (red arrow) was found in whole-mount in situ hybridization (WISH) between CTRL and PT. Scale bar, 40 µm. m qPCR showed significantly increased expression of lcp1 + leukocytes in the head after peripheral trauma. Independent t test, **, p < 0.01. n Experimental setup for dendra2 photoconversion and peripheral leukocyte tracking. o–p A significantly elevated number of photoconverted magenta+ leukocytes (white arrow) in the brains of zebrafish after peripheral trauma. Independent t test, **, p < 0.01. Scale bar, 40 µm.