- Title
-
In vivo impact of JAK3 A573V mutation revealed using zebrafish
- Authors
- Basheer, F., Bulleeraz, V., Ngo, V.Q.T., Liongue, C., Ward, A.C.
- Source
- Full text @ Cell. Mol. Life Sci.
|
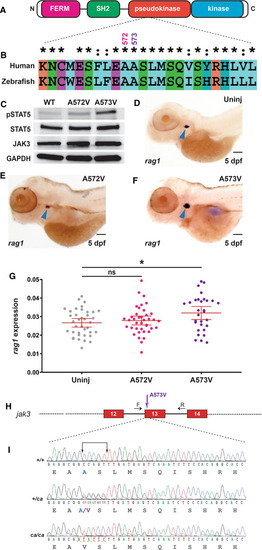
Conservation of human JAK3 constitutively-activating mutations in zebrafish. A JAK3 structure. Schematic representation of JAK3 including the FERM (pink), SH2 (green), pseudokinase (red) and kinase (blue) domains, which are all present in zebrafish Jak3. B Conservation of human and zebrafish JAK3. Human JAK3 and zebrafish Jak3 were aligned using CLUSTALX, showing identical (*) and highly similar (:) residues around A572/A573. C Analysis of zebrafish Jak3 mutants in vitro. Western blot analysis of HEK293 cells transfected with wild-type Jak3?+?Stat5.1 (WT), Jak3 A572V?+?Stat5.1 (A572V) and Jak3 A573V?+?Stat5.1 (A573V) using anti-phospho-STAT5 (pSTAT5), anti-STAT5, anti-HA (JAK3) and anti-GAPDH antibodies, as indicated. D?G Analysis of zebrafish Jak3 mutants in vivo. Uninjected (Uninj) embryos (D) or those injected with mRNA encoding Jak3 A572V (E) or A573V (F), were subjected to WISH with rag1 and imaged, with representative embryos shown. The area of rag1 expression was determined for individual embryos (G) with mean and SEM shown in red and level of statistical significance indicated (*p?<?0.05, ns: not significant; n?=?30) (6.3?×?magnification, scale bar?=?100 ?m). H Genome targeting of zebrafish jak3. Exon?intron structure of the target site with spanning primers (F, R) indicated by black arrows, with exons encoding the pseudokinase domain shown as numbered boxes and introns represented as solid lines, with the Jak3 A573V mutation denoted by a purple arrow. I The jak3 constitutively activating (ca) mutant alleles generated in zebrafish. The nucleotide sequence of homozygote wild-type (+/+), along with heterozygote (+/ca) and homozygote (ca/ca) mutant zebrafish are shown with the five bases mutated indicated and the introduced BciVI site boxed. The protein translations are shown below in black text, with the exception of wild-type A573 in blue and mutant V573 in purple |
|
Phenotypic analysis of zebrafish carrying the Jak3 A573V encoding allele. Embryos homozygous for Jak3 wildtype (jak3+/+) or Jak3 A573V (jak3ca/ca) or those heterozygous for Jak3 A573V (jak3+/ca) were subjected to WISH with ikzf1 at 3.5 dpf (A?C) and 5 dpf (E?G), rag1 (I?K), lck (M?O), tcra (Q?S), lyz (U?W) and mpo (Y?A?) at 5 dpf, as well as O-dianisidine staining (C??E?) (6.3/3.2?×?magnification, scale bar?=?200 ?m) or their blood analyzed with Giemsa staining at 5 dpf (F??H?; e, erythrocyte, l, lymphocyte) (100?×?magnification, scale bar?=?10 ?m). Individual embryos were assessed for relative area of staining with ikzf1 (D, H), rag1 (L), lck (P) and tcr? (T), for individual embryos or total number of lyz+ +(X) and mpo+ (B?) cells, or blood differential counts (I?) with the mean and SEM shown in red and level of statistical significance indicated (*p?<?0.05, **p?<?0.01, ***p?<?0.001, ns: not significant) (n?=?30 for WISH analysis and n?=?5 for blood counts) |
|
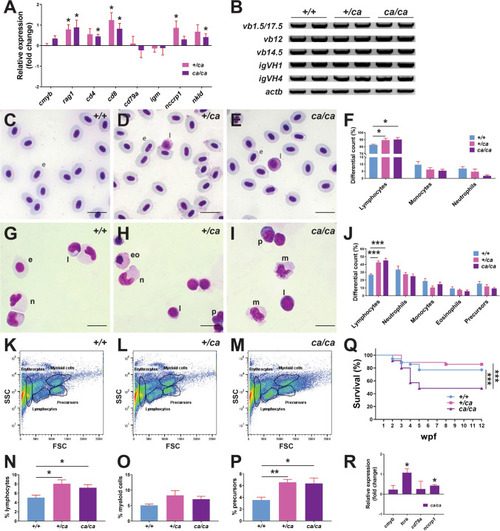
Effect of Jak3 A573V mutation on later hematopoiesis. A, B Gene expression analysis. Total RNA extracted from 28 dpf homozygous wild-type (jak3+/+), heterozygote (jak3+/ca) and homozygote (jak3ca/ca) mutant zebrafish was subjected to qRT2PCR analysis (A) with gene markers of hematopoietic stem cells (cmyb), T cells (rag1, cd4, cd8), B cells (cd79a, igm), and NK cells (nccrp1, nkld). Data are represented as relative fold change compared to homozygous wild-type (+/+) fish, with mean and SEM shown in red and statistical significance compared for Cq values normalized to control actb indicated (*p?<?0.05; n?=?3), or to RT-PCR (B) with primers specific for T cell receptor (TCR) ?-chain (v(d)jc? vb1.5, vb12, vb14.5) and B cell Ig heavy chain (igVH1, igVH4) rearrangements and actb as the control and analyzed by agarose gel electrophoresis. RT-negative controls yielded no products (data not shown) (n?=?2). C?J Histological analysis. Giemsa stained blood cells (C?E) and kidney cells (G?I) of adult wild-type (jak3+/+) (C, G), heterozygote (jak3+/ca) (D, H) and homozygote (jak3ca/ca) (E, I) fish, with differential counts for blood (F) and kidney (J) performed (e: erythrocyte, eo: eosinophil, l: lymphocyte, n: neutrophil, p: precursor, m: macrophage) (n?=?4?8; 100?×?magnification; scale bar?=?10 ?m). K?P FACS analysis. Kidney cells from adult wild-type (jak3+/+) (K), heterozygote (jak3+/ca) (L) and homozygote (jak3ca/ca) (M) were subjected to FACS analysis, with lymphoid (N) myeloid (O) and precursor (P) populations quantified, with mean and SEM shown in red and level of statistical significance indicated (*p?<?0.05, **p?<?0.01; n?=?5). Q Survival analysis. Wild-type (jak3+/+), heterozygote (jak3+/ca) and homozygote (jak3ca/ca) zebrafish were assessed weekly for survival, which is displayed as a Kaplan?Meier plot with level of statistical significance indicated (***p?<?0.001, n?=?35). R Gene expression analysis. Total RNA extracted from adult homozygous wild-type (jak3+/+), heterozygote (jak3+/ca) and homozygote (jak3ca/ca) zebrafish was subjected to qRT2PCR analysis with gene markers of hematopoietic stem cells (cmyb), T cells (tcra), B cells (cd79a), and NK cells (nccrp1), as described for panel A |
|
Molecular analysis of Jak3 A573V mutants. A-D. Genetic studies. Relative rag1 expression of jak3+/+, jak3+/ca and jak3ca/ca embryos on the indicated il2rga (A), jak1 (B), stat5.1 (C) and stat5.2 (D) genetic backgrounds, as detailed in Supp. Figure 1, 2, 3 and 4, respectively. Results for individual embryos of the relevant genotypes are shown along with mean and SEM in red and statistically significant differences indicated (*p?<?0.05, **p?<?0.01, ***p?<?0.001, ns: not significant, n?=?400). For simplicity, the results for some genotypes in panels A, B have been omitted. E Pharmacological studies. Relative rag1 expression of jak3+/+, jak3+/ca and jak3ca/ca embryos in the presence of the indicated Tofacitib concentrations. Results for individual embryos are shown along with mean and SEM in red and statistically significant differences indicated (***p?<?0.001, ns: not significant, n?=?400) |


