|
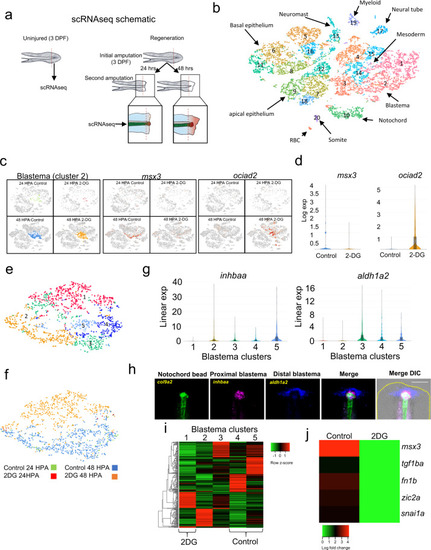
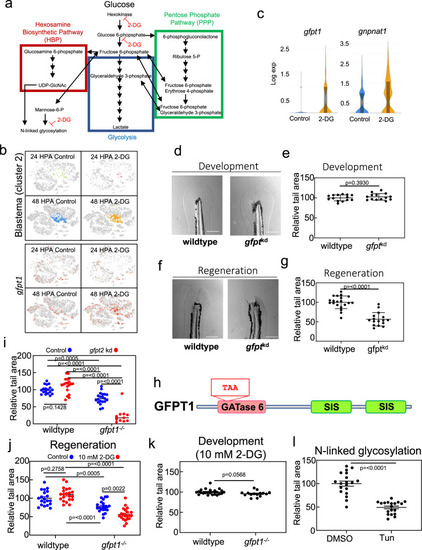
The HBP and N-linked glycosylation trigger tail regeneration.a Diagram depicting the HBP (red), glycolysis (blue), and the PPP (green). Single-head Arrows indicate pathway intermediates/products. Double-headed arrows indicate shared pathway substrates. Points where 2-DG acts as an inhibitor are indicated. b Expression of gfpt1 transposed onto the t-SNE plot of cells from the scRNA-seq, shown by library. c Violin plots of gfpt1 and gnpnat1 expression in control and 2-DG treated blastemas (cluster 2). d Image of the tail of 4 DPF embryos injected with Cas9 or Cas9 and gRNAs against gfpt1 and gfpt2 (gfptkd), set 1. Scale bar = 200 µm. e Quantification of tail area of 4 DPF embryos injected with Cas9 or Cas9 and gRNAs against gfpt1 and gfpt2 (gfptkd), set 1. Mean and SEM are shown. N = 14 embryos for control and 14 embryos for gfptkd. Statistics were determined an unpaired two-tailed t-test. f Image of 7 DPF embryo tails, 96 HPA, injected with Cas9 or Cas9 and gRNAs against gfpt1 and gfpt2 (gfptkd), set 1. Scale bar = 200 µm. g Quantification of tail area of 7 DPF embryos, 96 HPA, injected with Cas9 or Cas9 and gRNAs against gfpt1 and gfpt2 (gfptkd), set 1. Mean and SEM are shown. N = 20 embryos for control and 16 embryos for gfptkd. Statistics were determined an unpaired two-tailed t-test. h Cartoon depicting glutamine amidotransferase (GATase) 6 and sugar isomerase (SIS) domains of GFPT1. TAA indicates a premature stop codon introduced by a 20 bp deletion in gfpt1. i Quantification of tail area of wild-type or gfpt1−/− 7 DPF embryos, 96 HPA, injected with Cas9 or Cas9 and gRNAs against gfpt2. Mean and SEM are shown. Mean and SEM are shown. N = 18, 19, 20, and 11 embryos for wild-type control, wild-type gfpt2kd, gfpt1−/−, and gfpt1−/−; gfpt2kd groups. Statistics were determined with ordinary one-way ANOVA. j Quantification of tail area of 96 HPA wild-type or gfpt1−/− embryos with and without 10 mM 2-DG treatment. Mean and SEM are shown. N = 20–21 embryos for all conditions. Statistics were determined with two-way ANOVA. k Quantification of tail area of 4 DPF wild-type or gfpt1−/− embryos treated with 10 mM 2-DG. Mean and SEM are shown. N = 23 and wild-type embryos and 15 for gfpt1−/− embryos. Statistics were determined with an unpaired two-tailed t-test. l Quantification of tail area of 96 HPA embryos treated with DMSO or Tunicamycin. Drug was added to embryo media 2 h prior to amputations and washed out 24 HPA. Mean and SEM are shown. N = 19 for all conditions. Statistics were determined with an unpaired two-tailed t-test.
|

