|
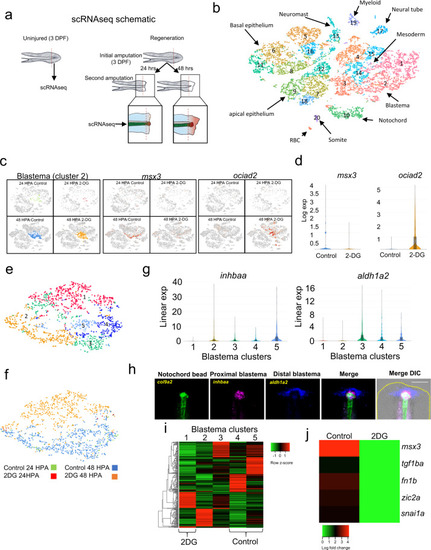
2-DG prevents formation of normal blastema.a Illustration depicting the region of uninjured and regenerating tail taken for scRNA-seq. b t-SNE plot generated from Louvain clustering of cells from the scRNA-seq data. Number indicates cluster number. c Expression of msx3 and ociad2 transposed onto the t-SNE plot of cells from the scRNA-seq, shown by library. d Violin plots of msx3 and ociad2 expression in control and 2-DG treated blastemas (cluster 2). e t-SNE plot of reclustered blastema. Numbers indicate cluster number. f t-SNE plot of blastema clusters depicted by library. g Violin plots of inhbaa and aldh1a2 expression in the reclustered blastema clusters. h RNA-FISH images of col9a2, inhbaa, and aldh1a2, which depict the notochord / notochord bud, proximal blastema and distal blastema, respectively, in a 48 HPA embryo. Yellow dashed line indicates outline of tail. Scale bar = 100 µm. i Heatmap of marker genes for each reclustered blastema cluster. Cluster 4 and 5 are almost exclusively comprised of untreated control cells while cluster 1 is almost exclusively comprised of 2-DG treated cells. j Heatmap of expression of mesenchymal and blastema genes suppressed by 2-DG treatment.
|