IMAGE

Fig. 3

ID
ZDB-IMAGE-210927-7
Source
Figures for Sinclair et al., 2021
Image
Figure Caption

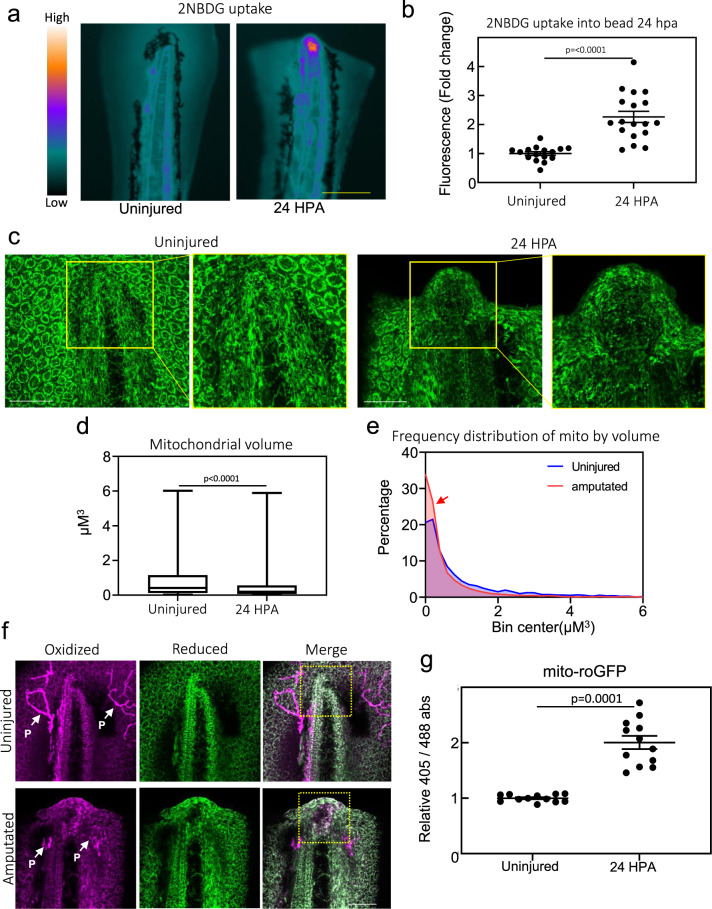
Fig. 3 Metabolic reprogramming during early regeneration.

a Heatmap of fluorescent intensity of uninjured and 24 HPA embryos pulsed with 500 µM 2-NBDG for 2 h. Scale bar = 200 µm. b Quantification of 2-NBDG fluorescence in tail of uninjured embryos and notochord bead of 24 HPA embryos. Mean and SEM are shown. N = 18–20 embryos per condition. Statistics were determined with an unpaired two-tailed t-test. c Confocal images of uninjured or 24 HPA Tg(actb2:mito-GFP) embryos. Right panels are zoomed-in images of boxed region in left panels. Scale bar = 50 µm. Images are sum z-stacks of 13 1 µM slices excluding epithelium above and below the notochord and notochord bead on the Z-axis. d Box and whisker plot of mitochondrial volume quantified from the notochord and notochord bead of uninjured and 24 HPA embryos, respectively. Boxes show the 25–75th percentiles, whiskers show the min and max. Lines in the middle of the boxes are the median. N for uninjured sample is 2914 mitochondria from 5 embryos. N for 24 HPA sample is 6791 mitochondria from 5 embryos. Statistics were determined with an unpaired two-tailed t-test. e Histogram of mitochondrial volume quantified from the notochord and notochord bead of uninjured and 24 HPA embryos, respectively. Red arrow indicates increased numbers of small mitochondria after amputation. N for uninjured sample is 2914 mitochondria from 5 embryos. N for 24 HPA sample is 6791 mitochondria from 5 embryos. f Confocal images of uninjured or 24 HPA Tg(actb2:mito-roGFP) embryos. Images are sum z-stacks of 17 1 µM slices excluding epithelium above and below the notochord and notochord bead on the Z-axis. P indicates auto-fluorescent pigment cells which are not depicting roGFP2. A region of oxidized mitochondria can be seen in amputated tails, depicted by the boxed region, which is not seen in a corresponding region of unamputated tails. Scale bar = 50 µm. g Quantification of relative absorbance of roGFP2 at 488 or 405 nm in the notochord bead of 24 HPA embryos or tail of uninjured embryos. N = 12 embryos per condition. Mean and SEM are shown. Statistics were determined with an unpaired two-tailed t-test.

Acknowledgments
This image is the copyrighted work of the attributed author or publisher, and ZFIN has permission only to display this image to its users. Additional permissions should be obtained from the applicable author or publisher of the image. Full text @ NPJ Regen Med