IMAGE

Fig. 4

ID
ZDB-IMAGE-210927-8
Source
Figures for Sinclair et al., 2021
Image
Figure Caption

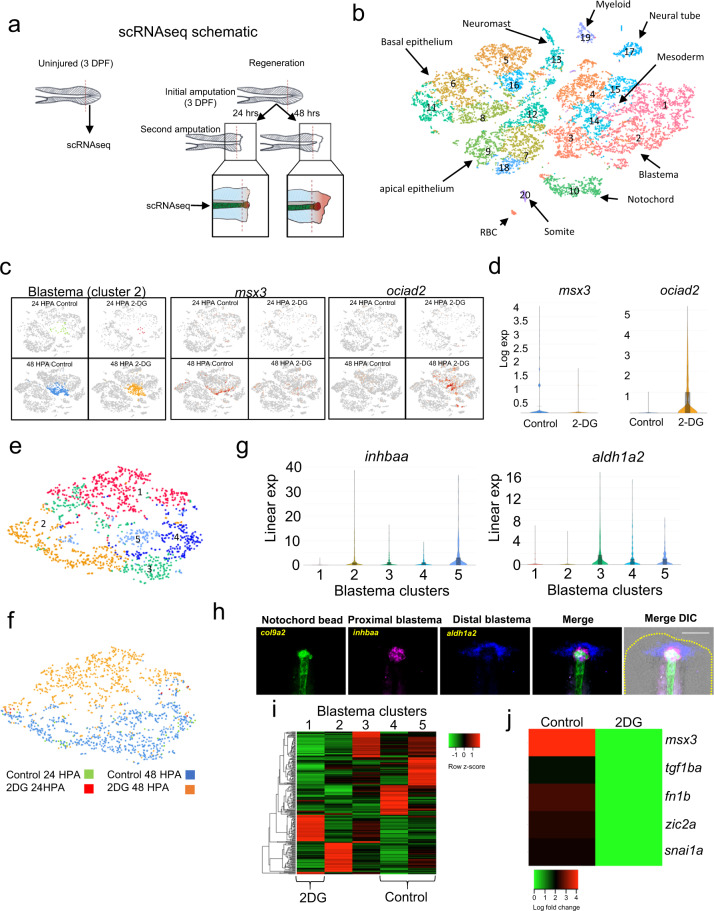
Fig. 4 2-DG prevents formation of normal blastema.

a Illustration depicting the region of uninjured and regenerating tail taken for scRNA-seq. b t-SNE plot generated from Louvain clustering of cells from the scRNA-seq data. Number indicates cluster number. c Expression of msx3 and ociad2 transposed onto the t-SNE plot of cells from the scRNA-seq, shown by library. d Violin plots of msx3 and ociad2 expression in control and 2-DG treated blastemas (cluster 2). e t-SNE plot of reclustered blastema. Numbers indicate cluster number. f t-SNE plot of blastema clusters depicted by library. g Violin plots of inhbaa and aldh1a2 expression in the reclustered blastema clusters. h RNA-FISH images of col9a2, inhbaa, and aldh1a2, which depict the notochord / notochord bud, proximal blastema and distal blastema, respectively, in a 48 HPA embryo. Yellow dashed line indicates outline of tail. Scale bar = 100 µm. i Heatmap of marker genes for each reclustered blastema cluster. Cluster 4 and 5 are almost exclusively comprised of untreated control cells while cluster 1 is almost exclusively comprised of 2-DG treated cells. j Heatmap of expression of mesenchymal and blastema genes suppressed by 2-DG treatment.

Acknowledgments
This image is the copyrighted work of the attributed author or publisher, and ZFIN has permission only to display this image to its users. Additional permissions should be obtained from the applicable author or publisher of the image. Full text @ NPJ Regen Med