FIGURE SUMMARY
Title

Metabolomic and transcriptomic profiling of adult mice and larval zebrafish leptin mutants reveal a common pattern of changes in metabolites and signaling pathways

Authors
Ding, Y., Haks, M.C., Forn-Cuní, G., He, J., Nowik, N., Harms, A.C., Hankemeier, T., Eeza, M.N.H., Matysik, J., Alia, A., Spaink, H.P.
Source
Full text @ Cell Biosci.

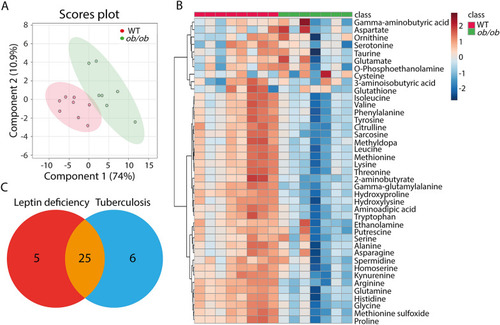
Metabolic profiles of blood from ob/ob and wild type C57BL/6 mice measured by mass spectrometry. A PLS-DA analysis of wild type and ob/ob mice, n = 15 in total, each replicate represents one mouse. PLS-DA partial least square discriminant analysis. WT wild type. B Heat map of 30 statistically significant biochemical markers profiled in this mice study. C A Venn diagram showing the overlap of the 30 metabolites of B with the set of wasting syndrome biomarkers published by Ding et al. [26]

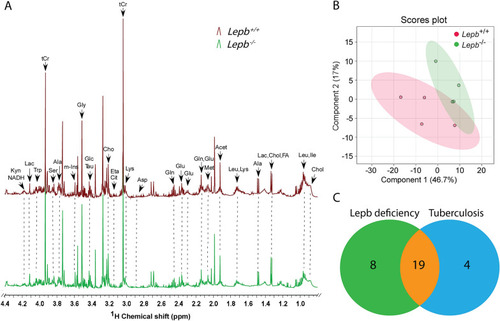
One-dimensional 1H NMR spectra and PLS-DA analysis of extracted lepb mutant zebrafish larvae. A The representative spectra of extracted larvae from wild type and lepb mutant groups measured by solution NMR spectrometry. Spectra from chemical shift 0.5–4.4 were assigned to specific metabolites. Acet acetate, Ala alanine, Arg arginine, Asp aspartate, Cho choline, Chol cholesterol, Cit citrulline, Eta ethanolamine, FA fatty acid, Glc glucose, Gln glutamine, Glu glutamate, Gly glycine, Ile isoleucine, Kyn kynurenine, Lac lactate, Leu leucine, Lys lysine, Met methionine, m-Ins myo-inositol, Ser serine, Tau taurine, tCr total creatine (creatine + phosphocreatine), Trp tryptophan, NMR nuclear magnetic resonance. B PLS-DA analysis of wild type and lepb mutant groups, n = 4, each replicate represents 105 pooled larvae. PLS-DA partial least square discriminant analysis. C A Venn diagram is shown of the common 19 metabolites that changed significantly towards lepb deficiency in extracted zebrafish larvae and tuberculosis caused by Mycobacterium marinum infection in extracted zebrafish larvae published by Ding et al. [26]

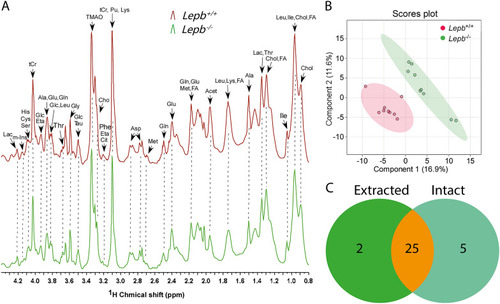
One-dimensional 1H HR-MAS NMR spectra and PLS-DA analysis of intact lepb mutant zebrafish larvae. A The representative spectra of intact larvae from wild type and lepb mutant groups measured by HR-MAS NMR spectrometry. Spectra from chemical shift 0.5–4.4 were assigned to specific metabolites. Acet acetate, Ala alanine, Asp aspartate, Cho choline, Chol cholesterol, Cit citrulline, Cys cysteine, Eta ethanolamine, FA fatty acid, Glc glucose, Gln glutamine, Glu glutamate, Gly glycine, His histidine, Ile isoleucine, Lac lactate, Leu leucine, Lys lysine, Met methionine, m-Ins myo-inositol, Pu putrescine, Ser serine, Tau taurine, tCr total creatine (creatine + phosphocreatine), Thr threonine, TAMO trimethylamine N-oxide, HR-MAS NMR high-resolution magic-angle-spinning nuclear magnetic resonance. B PLS-DA analysis of intact larvae from wild type and lepb mutant groups, n = 3, three times measurements, each replicate represents 120 pooled larvae. PLS-DA partial least square discriminant analysis. C A Venn diagram is shown of the common 25 metabolites that are significantly changed both in extracted zebrafish larvae measured by 1H solution NMR and intact larvae measured by 1H HR-MAS NMR

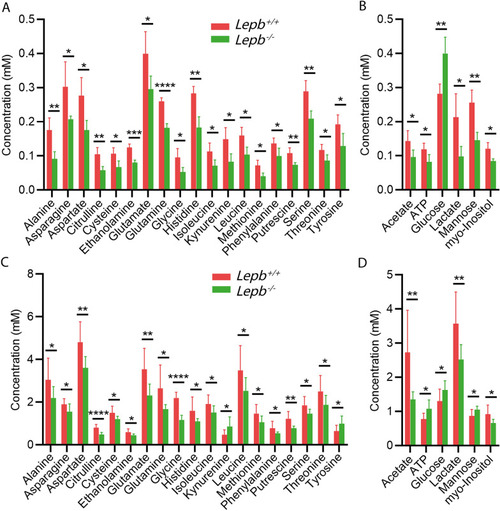
Quantification of the common 25 metabolites that are significantly changed in zebrafish larvae. A The concentration of amino acids and amines of wild type and lepb mutant in extracted larvae. B The concentration of ATP, carbohydrates and organic acids of wild type and lepb mutant in extracted larvae. C The concentration of amino acids and amines of wild type and lepb mutant in intact larvae. D The concentration of ATP, carbohydrates and organic acids of wild type and lepb mutant in intact larvae. *p < 0.05, **p < 0.01, ***p < 0.0005, ****p < 0.0001

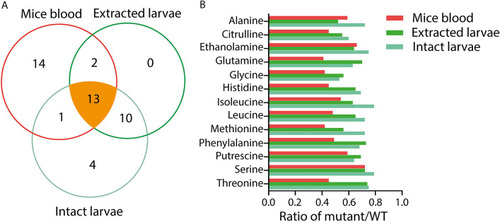
Common biomarkers for leptin deficiency in ob/ob mice, extracted and intact zebrafish larvae. A A Venn diagram shows that 13 common metabolites are significantly changed after leptin knockdown in mice blood, extracted and intact zebrafish larvae. B The ratio of leptin mutant versus wild type of the 13 common metabolites in the three metabolomic datasets

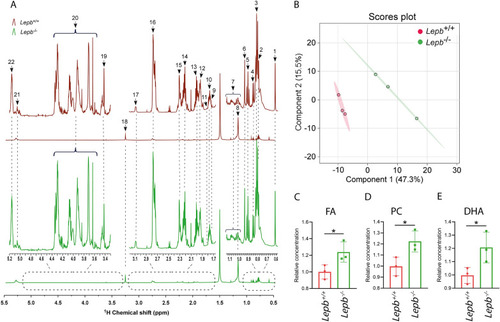
Lipid profiles of lepb mutant zebrafish larvae compared to wild type siblings. A The representative spectra of total lipid extracts from wild type and lepb mutant zebrafish larvae obtained by 1H NMR spectroscopy. The assignments of the peak numbers were shown in Additional file 1: Table S2. NMR nuclear magnetic resonance. B PLS-DA analysis of lepb mutant and wild type zebrafish larvae, n = 3, each replicate represents 105 pooled larvae. PLS-DA partial least square discriminant analysis. C The relative concentration of the signal 14 FA in A. FA fatty acids. D The relative concentration of the signal 18 PC in A. PC phosphatidylcholines. E The relative concentration of the signal 15 DHA in A. DHA docosahexaenoic acid. *p < 0.05

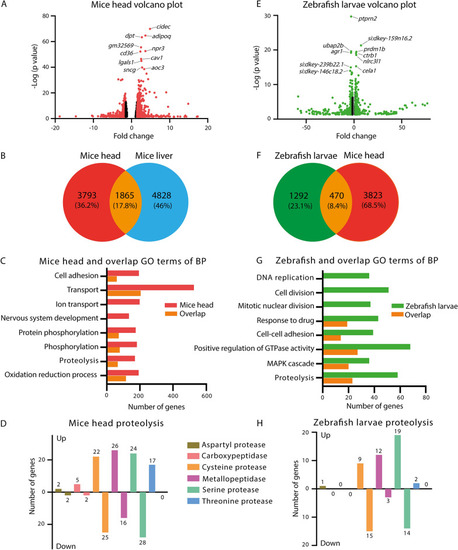
Transcriptome signature sets of mice and zebrafish larvae. A A Volcano plot showing a graphical representation of the significance (p < 0.05) in ob/ob mice head compared to C57BL/6 mice head. The transcripts with fold change over 1.5 are highlighted in red. Fifteen significant genes in mice head out of the fold change in X axis are excluded to make the graph look well. B A Venn diagram showing the comparison of the number of significantly changed genes between ob/ob mice head and mice liver published by Kokaji et al. C The top eight GO terms of biological process (BP) with lowest p adjusted values and highest numbers of genes representatives in mice head and the overlap of B. GO gene ontology. D Number of genes in classification of GO term proteolysis in the signature set of mice head. E A Volcano plot showing a graphical representation of the significance (p < 0.05) in lepb mutant zebrafish larvae compared to wild type siblings. The transcripts with fold change over 1.5 are highlighted in green. Twenty-two significant genes in zebrafish larvae out of the fold change in X axis are excluded to make the graph look well. F A Venn diagram showing the comparison of the number of significantly changed genes from human homologs of the signature gene sets of zebrafish larvae and ob/ob mice head. G The top eight GO terms of BP with lowest p adjusted values and highest numbers of genes representatives in zebrafish larvae and the overlap of F. H Number of genes in classification of GO term proteolysis in the signature set of zebrafish larvae

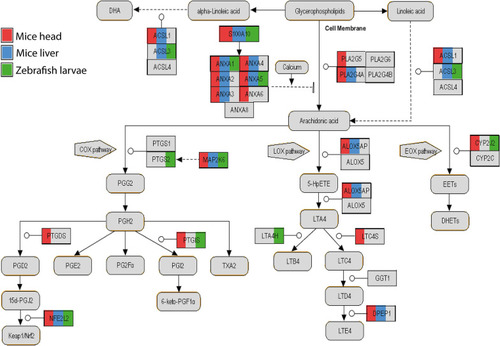
Genes involved in arachidonic acid pathway in human orthologs of the three transcriptome signature sets. Dashed lines means indirect regulation. Red color represents genes significantly changed in ob/ob mice head compared to control. Blue color represents genes significantly changed in ob/ob mice liver compared to wild type published by Kokaji et al. Green color represents genes significantly changed in lepb mutant zebrafish larvae compared to wild type siblings. COX cyclo-oxygenase, LOX lipoxygenase, EOX epoxygenase, DHA docosahexaenoic acid

Acknowledgments
This image is the copyrighted work of the attributed author or publisher, and ZFIN has permission only to display this image to its users. Additional permissions should be obtained from the applicable author or publisher of the image. Full text @ Cell Biosci.