IMAGE

Fig. 5

ID
ZDB-IMAGE-210712-36
Source
Figures for Ding et al., 2021
Image
Figure Caption

Fig. 5

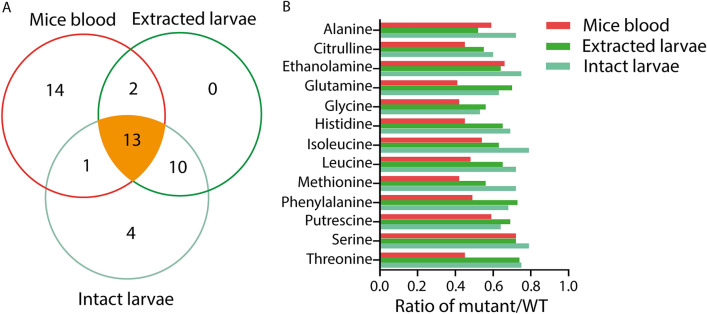
Common biomarkers for leptin deficiency in ob/ob mice, extracted and intact zebrafish larvae. A A Venn diagram shows that 13 common metabolites are significantly changed after leptin knockdown in mice blood, extracted and intact zebrafish larvae. B The ratio of leptin mutant versus wild type of the 13 common metabolites in the three metabolomic datasets

Figure Data
Acknowledgments
This image is the copyrighted work of the attributed author or publisher, and ZFIN has permission only to display this image to its users. Additional permissions should be obtained from the applicable author or publisher of the image. Full text @ Cell Biosci.