FIGURE

Fig. 6

ID
ZDB-FIG-210712-37
Publication
Ding et al., 2021 - Metabolomic and transcriptomic profiling of adult mice and larval zebrafish leptin mutants reveal a common pattern of changes in metabolites and signaling pathways
Other Figures
All Figure Page
Back to All Figure Page
Fig. 6

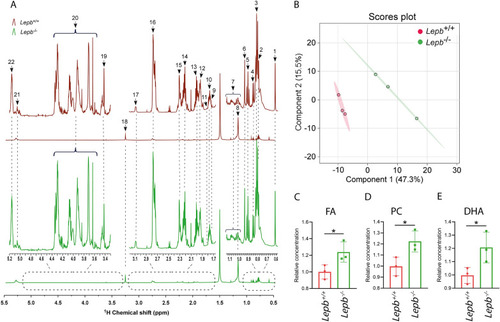
Lipid profiles of lepb mutant zebrafish larvae compared to wild type siblings. A The representative spectra of total lipid extracts from wild type and lepb mutant zebrafish larvae obtained by 1H NMR spectroscopy. The assignments of the peak numbers were shown in Additional file 1: Table S2. NMR nuclear magnetic resonance. B PLS-DA analysis of lepb mutant and wild type zebrafish larvae, n = 3, each replicate represents 105 pooled larvae. PLS-DA partial least square discriminant analysis. C The relative concentration of the signal 14 FA in A. FA fatty acids. D The relative concentration of the signal 18 PC in A. PC phosphatidylcholines. E The relative concentration of the signal 15 DHA in A. DHA docosahexaenoic acid. *p < 0.05

Expression Data

Expression Detail
Antibody Labeling
Phenotype Data
Fish:
Observed In:
Stage: Day 5

Phenotype Detail
Acknowledgments
This image is the copyrighted work of the attributed author or publisher, and ZFIN has permission only to display this image to its users. Additional permissions should be obtained from the applicable author or publisher of the image. Full text @ Cell Biosci.