IMAGE

Fig. 1

ID
ZDB-IMAGE-210712-32
Source
Figures for Ding et al., 2021
Image
Figure Caption

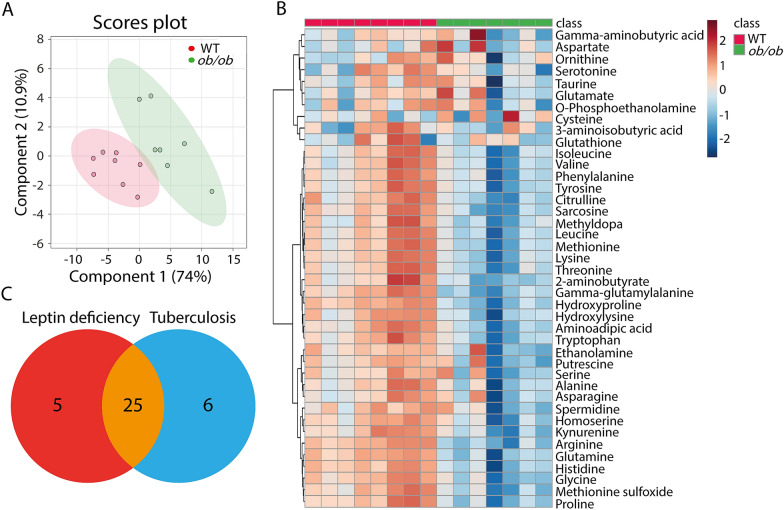
Fig. 1

Metabolic profiles of blood from ob/ob and wild type C57BL/6 mice measured by mass spectrometry. A PLS-DA analysis of wild type and ob/ob mice, n = 15 in total, each replicate represents one mouse. PLS-DA partial least square discriminant analysis. WT wild type. B Heat map of 30 statistically significant biochemical markers profiled in this mice study. C A Venn diagram showing the overlap of the 30 metabolites of B with the set of wasting syndrome biomarkers published by Ding et al. [26]

Acknowledgments
This image is the copyrighted work of the attributed author or publisher, and ZFIN has permission only to display this image to its users. Additional permissions should be obtained from the applicable author or publisher of the image. Full text @ Cell Biosci.