FIGURE SUMMARY
Title

Isthmin1, a secreted signaling protein, acts downstream of diverse embryonic patterning centers in development

Authors
Kesavan, G., Raible, F., Gupta, M., Machate, A., Yilmaz, D., Brand, M.
Source
Full text @ Cell Tissue Res.

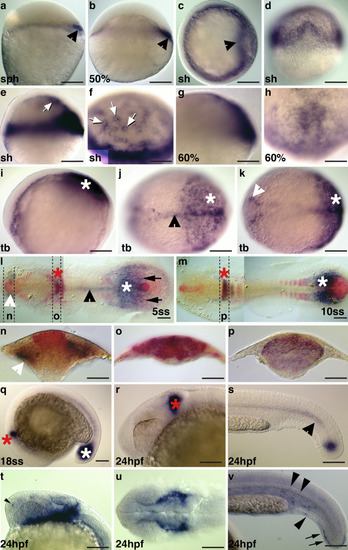
Expression of ism1 and ism2 during zebrafish embryogenesis. Whole mount ISH was performed at the indicated stages during zebrafish embryogenesis with riboprobes against ism1 (panels as; detected in purple), fgf8 (panels lp, detected in red) and ism2 (tv; detected in purple). a, b, e, g Lateral views, dorsal to the right; c animal view, shield to the right; d corresponding dorsal view, animal to the top; f, h animal-dorsal views; i lateral view, anterior to the left; j, k corresponding dorsal views; l, m flat-mounted embryos, dorsal view, anterior to the left; np transverse sections at indicated positions in panels l and m. qt, v Lateral views, anterior to the left. u Dorsal view, anterior to the left. Stages are indicated as % epiboly or as sph: sphere stage, sh: shield stage, tb: tailbud stage; ss: somite stage (5, 10, 18ss correspond to 5, 10, or 18 somite stage). Arrowheads in a, b, and c represent dorsal expression domain; arrows in e and f represent expression around YSL nuclei; white asterisks in i and m correspond to presomitic mesoderm; black arrowhead in j and s point to axial mesoderm/notochord; white arrowhead in k points to adaxial cells; white arrowhead in l and n corresponds to head mesenchyme; arrows in l point to ism1 expression close to Kupffer’s vesicle; asterisks in q and s represent tailbud; red asterisks in l, m, q, and r correspond to the MHB; arrowhead in t points to expression in the nasal primodium; arrowheads in v represent scattered expression in the trunk; arrows in v point to expression in the tailfin bud. Scale bar: 200 μm in ae and ik; 100 μm in fh, q, nr, and rv

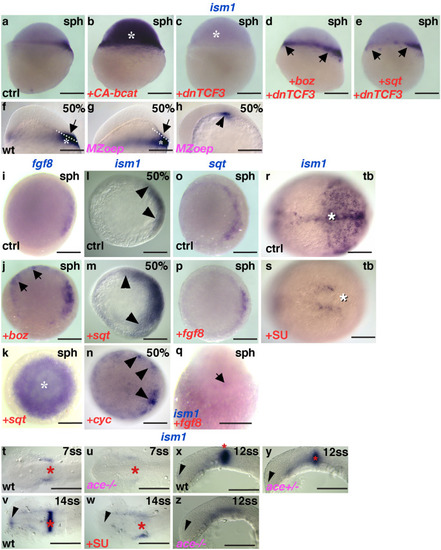
Ism1 expression depends on dorsal determinants, and Nodal and Fgf signaling. Misexpression of constitutively active β-catenin induces ectopic ism1 expression b, asterisk compared with controls a; c conversely, dominant negative TCF3 diminishes ism1 expression; However, bozd and sqte can induce ism1 (arrows) in the absence of Wnt/β -catenin signaling. f, gism1 expression in the blastoderm (arrows) is absent in MZoep mutants, while its expression in the YSL remains unaffected (asterisks). h Residual ism1 expression in MZoep mutants at the end of gastrulation (arrowhead). Both bozj and sqtk elicit ectopic fgf8 expression (arrows, asterisk) compared with controls i. Both sqtm and cycn elicit ectopic ism1 expression compared with controls l. oq Neither sqtp nor ism1 are ectopically induced by fgf8 overexpression. rz Fgf-dependence of ism1; r, s Pharmacological FgfR inhibition during gastrulation abolishes ism1 expression in the axial mesoderm and in the posterior paraxial mesoderm (white asterisks); v, w FgfR inhibition during somitogenesis abolishes ism1 expression in the MHB (red asterisks) and forebrain (arrowheads); (t,u,x,z) ism1 expression in the MHB (asterisk) and forebrain (arrowhead) is missing in fgf8/ace mutants. Note that expression in the MHB in panels xz appears to depend on the genetic dose of fgf8. Genotypes (pink), stages (black), treatment (red), and riboprobes (blue) are indicated on the panels. a-g Lateral views, dorsal to the right; h, xz lateral views, anterior to the left; ip animal views, dorsal to the right if discernible; q dorsal view, animal pole to the top; rw dorsal views, anterior to the left. Scale bar: 200 μm in ae and iq; 100 μm in fh and rz

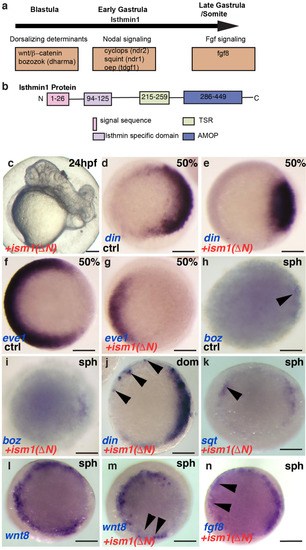
Dorsalization of embryos in ism1 deletion mutants. a Schematic representation of upstream regulators of ism1 during various stages of embryonic development. b Schematic representation of the Ism1 protein and the amino acid length of its domains, signal sequence, Isthmin specific domain (ISD), thrombospondin-type 1 repeat (TSR), and an adhesion-associated domain in Muc4 and other proteins (AMOP). c Dorsalized and cyclopic phenotype observed in ism1 (∆N) mRNA-injected embryos at 24 hpf (see Table 1). dg Dorsalization of the injected embryos at 50% epiboly, or late blastula (see Table 2). d, f Uninjected controls and e, g ism1(∆N)-injected embryos were probed for din and eve1 as dorsal and ventral markers, respectively. h, iboz appears unchanged after injection of ism1 (∆N). j, k, ndin, sqt, and fgf8 can be induced by ism1 (∆N) ectopically (arrowheads); l, m wnt8 (ORF1 + ORF2) is downregulated in the marginal zone. Left is ventral, and right is dorsal in all pictures. dn Animal pole views. The time of color development is shortened in k to emphasize the ectopic up-regulation of sqt expression. Scale bar: 200 μm

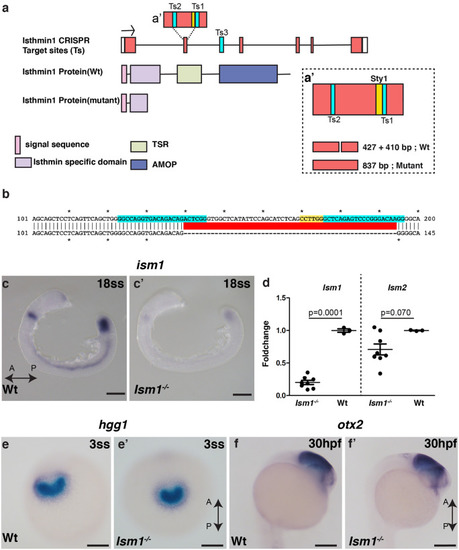
Generation and characterization of ism1 mutants a CRISPR gRNA target sites (Ts) were located in the exon (Ts1 and Ts2) and in the intron (Ts3). The sty1 restriction site is marked in yellow. Scheme representing protein domains in wild-type Ism1 and in the truncated version in CRISPR mutants are shown. Schematic representation of the genotyping strategy shown in a′, loss of the Sty1 restriction site in the mutants will result in an 837-bp band, while in the Wt there will be two bands (i.e., 437 + 410). b Sequence alignment between Wt and Ism1 mutant embryos shows 55 bp deletion, in cyan (Ts), and yellow (Sty1 restriction site). c and c′ Whole mount in situ hybridization in 18 somite stage (18ss; 18 hpf) embryos for Ism1 shows decreased expression in Ism1−/− embryos compared with the wild type (Wt) embryos. d qRT PCR for Ism1 and Ism2 in 24 hpf embryos of ism1−/− mutants show a significant reduction in only Ism1 mRNA with no change in Ism2 levels. e and e′ Whole mount in situ hybridization for hgg1, a marker for the anterior prechordal plate and the later hatching gland, shows similar expression and distribution patterns in the hatching gland between Wt and Ism1−/− embryos. Ventral images are shown. f and f′ Midbrain marker otx2 shows no obvious difference between Wt and Ism1−/− embryos. The anterior–posterior axis of the embryo is marked as A-P with an arrow. The total number of embryos n analyzed in panels c (n = 20), d (ism1−/−: n = 8, Wt: n = 3), e (n = 40), and f (n = 40). P values from unpaired t tests are indicated within the graph d. Scale bar 100 μm

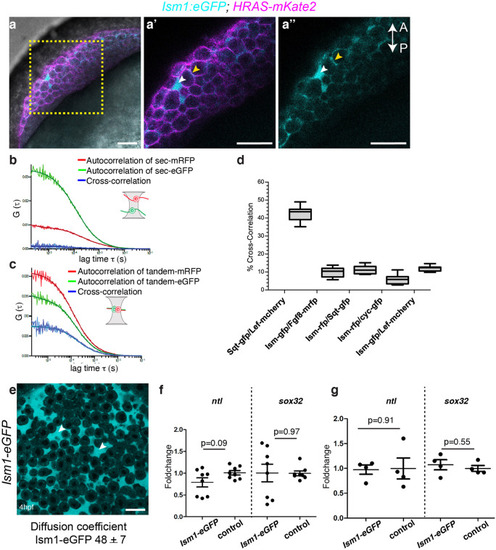
Ism1 interaction with Fgf8 and Nodal molecules in vivo a Ism1-eGFP and membrane localized mKate2 (HRAS-mKate2) was co-injected at 1-cell stage embryo, and images from live embryos were obtained at 50% epiboly (5.3 hpf). Ism1-eGFP was predominantly observed in the extra cellular space (white arrowhead) and close to the plasma membrane (yellow arrowhead). a′ and a″ Magnified images of the marked region in a. b, c By cross-correlating fluorescence fluctuations (FCCS) in two spectral channels, bimolecular binding can be inferred because only co-diffusing binding partners lead to a considerable cross-correlation. Coinjection of secreted mRFP (Sec-mRFP) and secreted eGFP (Sec-eGFP) showed no cross- correlation, while a tandem construct with mRFP and eGFP showed cross- correlation. d. sqt and lefty have about 45% cross correlation, while that between Ism1 and fgf8a, sqt, cyc, or lefty was about 15%, which is in the range of random interactions (background). e The diffusion coefficient of Ism1-eGFP was measured using FCS in the extracellular space (indicated with arrowhead) of sphere stage embryos (4 hpf) injected with Ism1-eGFP mRNA at the 1-ll stage. Ism1-eGFP diffusion coefficient was 48 ± 7 μm2 s−1 f and g. qRT PCR analysis of Ism1-eGFP or mCerulean (control) injected embryos (mRNA or DNA) showed no significant difference in the gene expression levels of the mesoderm marker ntl or the endoderm marker sox32. Embryos were harvested at 50% epiboly (5.3 hpf), and each sample represents a pool of 10 embryos. P values from unpaired t tests are indicated within the graph. Numbers of embryos analyzed for FCS and FCCS are presented in Table 3. The total number of embryos (n) analyzed in panel a (n = 8). Scale bar 20 μm

Acknowledgments
This image is the copyrighted work of the attributed author or publisher, and ZFIN has permission only to display this image to its users. Additional permissions should be obtained from the applicable author or publisher of the image. Full text @ Cell Tissue Res.