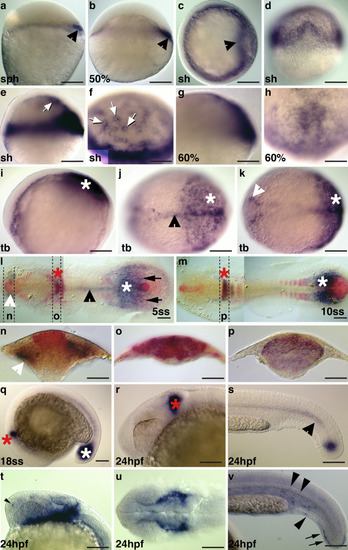
Expression of ism1 and ism2 during zebrafish embryogenesis. Whole mount ISH was performed at the indicated stages during zebrafish embryogenesis with riboprobes against ism1 (panels a–s; detected in purple), fgf8 (panels l–p, detected in red) and ism2 (t–v; detected in purple). a, b, e, g Lateral views, dorsal to the right; c animal view, shield to the right; d corresponding dorsal view, animal to the top; f, h animal-dorsal views; i lateral view, anterior to the left; j, k corresponding dorsal views; l, m flat-mounted embryos, dorsal view, anterior to the left; n–p transverse sections at indicated positions in panels l and m. q–t, v Lateral views, anterior to the left. u Dorsal view, anterior to the left. Stages are indicated as % epiboly or as sph: sphere stage, sh: shield stage, tb: tailbud stage; ss: somite stage (5, 10, 18ss correspond to 5, 10, or 18 somite stage). Arrowheads in a, b, and c represent dorsal expression domain; arrows in e and f represent expression around YSL nuclei; white asterisks in i and m correspond to presomitic mesoderm; black arrowhead in j and s point to axial mesoderm/notochord; white arrowhead in k points to adaxial cells; white arrowhead in l and n corresponds to head mesenchyme; arrows in l point to ism1 expression close to Kupffer’s vesicle; asterisks in q and s represent tailbud; red asterisks in l, m, q, and r correspond to the MHB; arrowhead in t points to expression in the nasal primodium; arrowheads in v represent scattered expression in the trunk; arrows in v point to expression in the tailfin bud. Scale bar: 200 μm in a–e and i–k; 100 μm in f–h, q, n–r, and r–v
|
