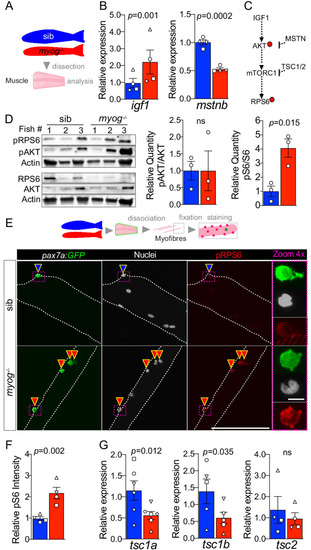
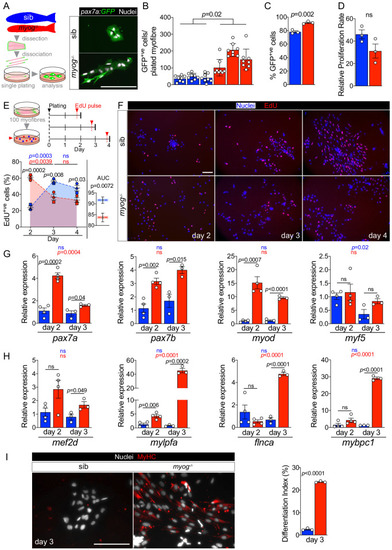
FIGURE SUMMARY
Title

Myogenin is an essential regulator of adult myofibre growth and muscle stem cell homeostasis

Authors
Ganassi, M., Badodi, S., Wanders, K., Zammit, P.S., Hughes, S.M.
Source
Full text @ Elife

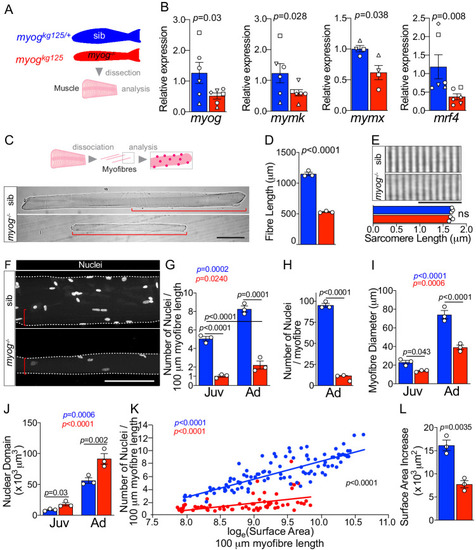
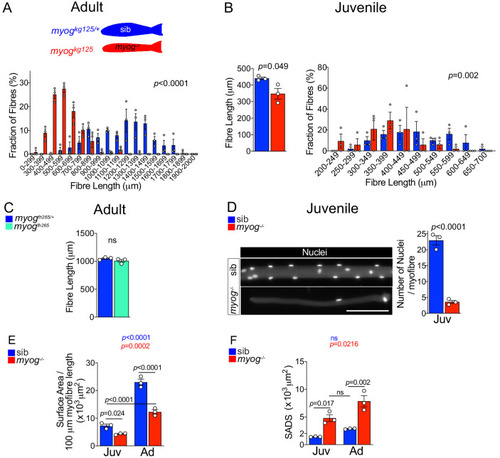
<italic>Myog<sup>kg125</sup></italic> mutant adult and juvenile myofibres are smaller.

(A) Fraction of adult myofibres (%) with indicated length in sib (blue, myogkg125/+) and myog-/- (red, myogkg125). n = 3 fish/genotype, n = 110–120 myofibres/fish, p-value indicates probability of rejecting null hypothesis of no difference between myog-/- and sib in χ2 test. (B) Measurement of 1-month-old juvenile myofibre length, n = 3 fish/genotype, unpaired t-test (left) and fraction of juvenile myofibres (%) with indicated length in sib (blue) and myog-/- (red), n = 3 fish/genotype, n = 15–20 juvenile myofibres/fish, p-value indicates probability of rejecting null hypothesis of no difference between myog-/- and sib in χ2 test. (right). (C) Measure of absolute adult myofibre length, n = 3 fish/genotype, n = 100 myofibres/fish, unpaired t-test; sib (blue, myogfh265/+), hypomorphic mutant (cyan, myogfh265). (D) Representative images showing sib and myog-/- juvenile myofibres (left), scale bar = 100 µm. Quantification of absolute number of nuclei per juvenile myofibre. n = 3 fish/genotype, n = 15–20 myofibres/fish, unpaired t-test. (E–F) Quantification of average surface area/100 µm myofibre length (E) and SADS (Surface Area Domain Size) (F) showing significant changes at juvenile (Juv) and adult (Ad) stages within (coloured p) or among (black p) genotypes. n = 3 fish/genotype, n = 30–50 adult myofibre/fish, n = 15–20 juvenile myofibre/fish, one-way ANOVA.

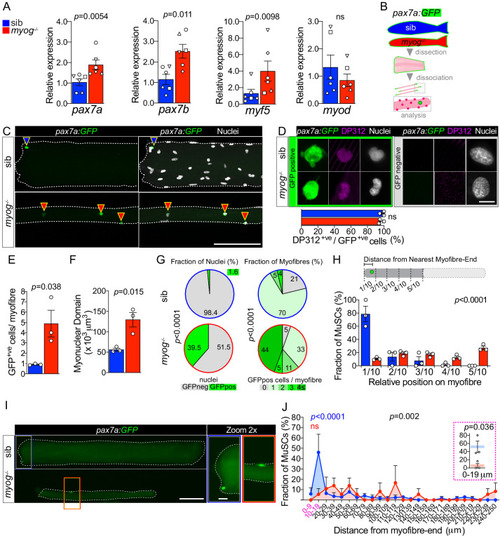
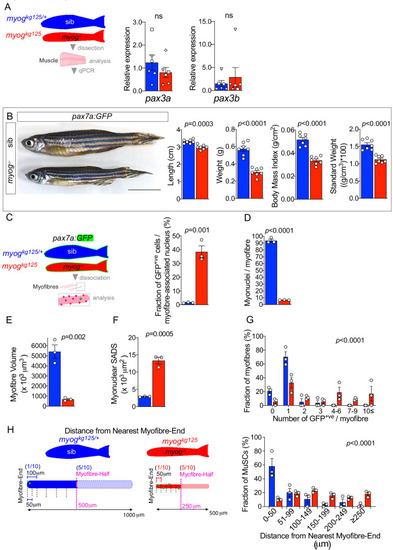
<italic>pax7a:GFP;myog<sup>kg125</sup></italic> muscle is smaller and displays altered MuSC cellularity and unchanged <italic>Pax3</italic> genes expression.

(A) Schematic of trunk muscle processing for qPCR analysis (left), sib (blue), myog-/- (red). Expression of pax3a and pax3b mRNAs is unchanged in myog-/- muscle (right). Symbol shapes denote paired sib and myog-/- samples, n = 6 fish/genotype, paired t-test. (B) Representative images of adult pax7a:GFP;myog+/- (sib) and pax7a:GFP;myog-/- (left). Scale bar = 1 cm. Quantification showing reduced length, weight, body mass index and standard weight in myog-/- compared to co-reared sibs (right), n = 7, unpaired t-test. (C) Schematic of pax7a:GFP adult trunk muscle processing for MuSC analysis (left). Fraction of GFP+ve cells (bona fide MuSCs) per myofibre-associated nucleus is significantly increased in myog-/- muscle (right). n = 3 fish/genotype, unpaired t-test. (D) Quantification of absolute number of (non-MuSC, GFP-ve) myonuclei per adult myofibre. n = 3 fish/genotype, n = 20–30 myofibres/fish, unpaired t-test. (E,F) Quantification of absolute myofibre volume and myonuclear SADS (Surface Area Domain Size). n = 3 fish/genotype, n = 20–30 myofibres/fish, unpaired t-test. (G) Fraction of myofibres (%) with indicated number of GFP+ve cells (MuSCs), n = 3 fish/genotype, n = 20–30 myofibres/fish,p-value indicates probability of rejecting null hypothesis of no difference between myog-/- and sib in χ2 test. (H) Schematic of GFP+ve cell distance to nearest myofibre-end measurement (left). Note that while average half-length (in magenta) of sib myofibre (blue diagram) is 500 µm, myog-/- myofibre average half-length is 250 µm (red diagram). To compare absolute distance to myofibre-end, each myofibre was segmented into 50 µm segments and the fraction of GFP+ve cells (%) within each distance segment from nearest myofibre-end plotted, n = 3 fish/genotype, n = 20–30 MuSCs/fish, p-value indicates probability of rejecting null hypothesis of no difference between myog-/- and sib in χ2 test. Note that in sibs almost no GFP+ve MuSCs were located in the central 50% of their myofibre. All graphs report mean ± SEM.

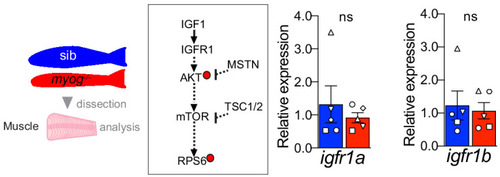
<italic>Myog<sup>-/-</sup></italic> mutant muscle displays unaltered <italic>igfr1a</italic> and <italic>igfr1b</italic> mRNA expression.

Schematic of adult trunk muscle processing for qPCR analysis (left). Summary of mTORC1 pathway with analysed members, positive (arrows) or negative (bars) effects are indicated (centre). Dashed lines indicate other molecules involved, plain arrow indicate direct effect, red dots represent phosphorylation. Igfr1a and igfr1b are unchanged in myog-/- muscle compared to sib (right). Symbol shapes denote paired sib and myog-/- samples, n = 5 fish/genotype, paired t-test.

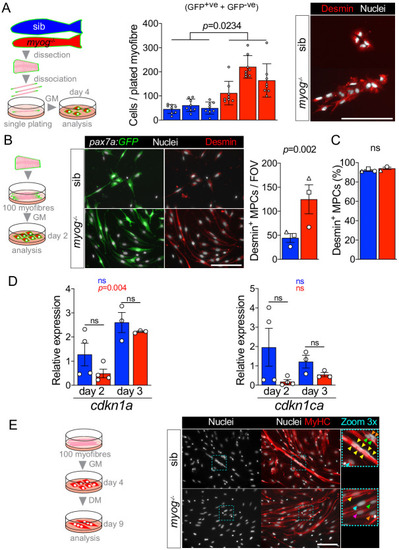
Characteristics of cultured MPCs and mRNA analysis.

(A) Schematic of single myofibre culture and analysis of derived MPCs after 4 days from plating in growth medium (left). Total number of cells (= GFP+ve + GFP-ve) is increased in myog-/- (centre). n = 3 fish/genotype, n = 8 myofibre/fish. Unpaired t-test on average number of cells/fish/genotype. Representative immunostaining of Desmin (red) and nuclei (white) confirming myogenic identity of both sib and myog-/- cells from single-plated myofibres at 4 days (right). (B) Schematic of 90–100 myofibres culture in growth medium (GM) and analysis of derived MPCs (left). Representative immunostaining of Desmin (red), GFP (green) and nuclei (white) confirming myogenic identity of both sib and myog-/- cells after 2 days of culture (centre). Myog-/- myofibres yielded higher number of Desmin+ MPCs per field of view (FOV). Symbol shapes denote paired sib and myog-/- samples, n = 3 fish/genotype, paired t-test (right). (C) 90–100 myofibres cultured from each genotype yielded over 90% of Desmin+ cells, confirming high purity of the MPC population, n = 3 fish/genotype, unpaired t-test. (D) qPCR analysis shows expression dynamics of cdkn1a (p21) and cdkn1ca (p57) mRNAs in sib and myog-/- MPCs cultured for 2 (n = 4) or 3 days (n = 3), unpaired t-test. Statistical significance within (coloured p) or between (black p) genotypes is indicated. (E) Schematic of 90–100 myofibres culture and analysis of derived MPCs cultured for 5 days in differentiation medium (DM), following expansion for 4 days in growth medium (GM) (left). Representative immunostaining of MyHC (red), nuclei (white) confirming that fusion into multinucleated myotubes occurred only in sib MCPs, whereas differentiated myog-/- cells remained mostly mononucleated, as reported previously (Ganassi et al., 2018) (right). Dashed cyan squares highlight 3x-magnified cells, coloured arrowheads indicate nuclei of each separate differentiated cell. All graphs report mean ± SEM. Scale bars = 100 µm.

Acknowledgments
This image is the copyrighted work of the attributed author or publisher, and ZFIN has permission only to display this image to its users. Additional permissions should be obtained from the applicable author or publisher of the image. Full text @ Elife