|
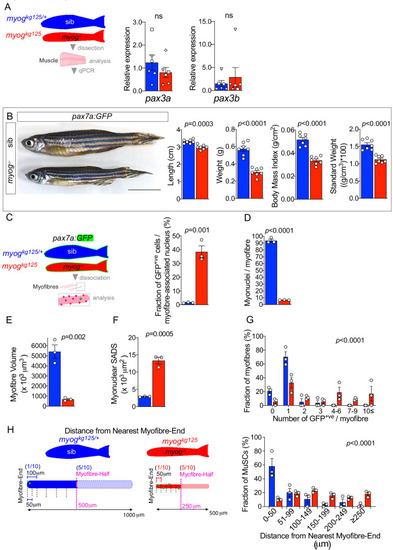
<italic>pax7a:GFP;myog<sup>kg125</sup></italic> muscle is smaller and displays altered MuSC cellularity and unchanged <italic>Pax3</italic> genes expression.(A) Schematic of trunk muscle processing for qPCR analysis (left), sib (blue), myog-/- (red). Expression of pax3a and pax3b mRNAs is unchanged in myog-/- muscle (right). Symbol shapes denote paired sib and myog-/- samples, n = 6 fish/genotype, paired t-test. (B) Representative images of adult pax7a:GFP;myog+/- (sib) and pax7a:GFP;myog-/- (left). Scale bar = 1 cm. Quantification showing reduced length, weight, body mass index and standard weight in myog-/- compared to co-reared sibs (right), n = 7, unpaired t-test. (C) Schematic of pax7a:GFP adult trunk muscle processing for MuSC analysis (left). Fraction of GFP+ve cells (bona fide MuSCs) per myofibre-associated nucleus is significantly increased in myog-/- muscle (right). n = 3 fish/genotype, unpaired t-test. (D) Quantification of absolute number of (non-MuSC, GFP-ve) myonuclei per adult myofibre. n = 3 fish/genotype, n = 20–30 myofibres/fish, unpaired t-test. (E,F) Quantification of absolute myofibre volume and myonuclear SADS (Surface Area Domain Size). n = 3 fish/genotype, n = 20–30 myofibres/fish, unpaired t-test. (G) Fraction of myofibres (%) with indicated number of GFP+ve cells (MuSCs), n = 3 fish/genotype, n = 20–30 myofibres/fish,p-value indicates probability of rejecting null hypothesis of no difference between myog-/- and sib in χ2 test. (H) Schematic of GFP+ve cell distance to nearest myofibre-end measurement (left). Note that while average half-length (in magenta) of sib myofibre (blue diagram) is 500 µm, myog-/- myofibre average half-length is 250 µm (red diagram). To compare absolute distance to myofibre-end, each myofibre was segmented into 50 µm segments and the fraction of GFP+ve cells (%) within each distance segment from nearest myofibre-end plotted, n = 3 fish/genotype, n = 20–30 MuSCs/fish, p-value indicates probability of rejecting null hypothesis of no difference between myog-/- and sib in χ2 test. Note that in sibs almost no GFP+ve MuSCs were located in the central 50% of their myofibre. All graphs report mean ± SEM.
|