|
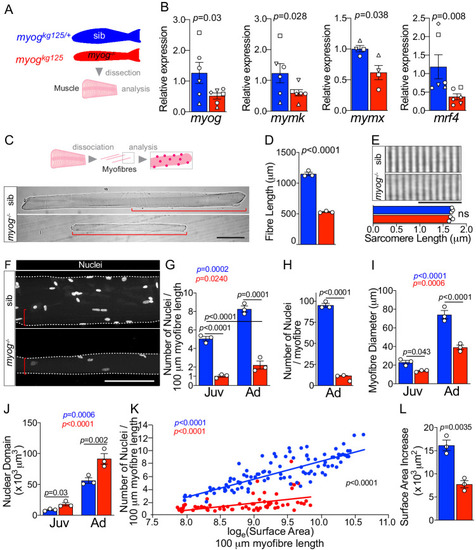
<italic>Myog<sup>kg125</sup></italic> mutant adult and juvenile myofibres are smaller.(A) Fraction of adult myofibres (%) with indicated length in sib (blue, myogkg125/+) and myog-/- (red, myogkg125). n = 3 fish/genotype, n = 110–120 myofibres/fish, p-value indicates probability of rejecting null hypothesis of no difference between myog-/- and sib in χ2 test. (B) Measurement of 1-month-old juvenile myofibre length, n = 3 fish/genotype, unpaired t-test (left) and fraction of juvenile myofibres (%) with indicated length in sib (blue) and myog-/- (red), n = 3 fish/genotype, n = 15–20 juvenile myofibres/fish, p-value indicates probability of rejecting null hypothesis of no difference between myog-/- and sib in χ2 test. (right). (C) Measure of absolute adult myofibre length, n = 3 fish/genotype, n = 100 myofibres/fish, unpaired t-test; sib (blue, myogfh265/+), hypomorphic mutant (cyan, myogfh265). (D) Representative images showing sib and myog-/- juvenile myofibres (left), scale bar = 100 µm. Quantification of absolute number of nuclei per juvenile myofibre. n = 3 fish/genotype, n = 15–20 myofibres/fish, unpaired t-test. (E–F) Quantification of average surface area/100 µm myofibre length (E) and SADS (Surface Area Domain Size) (F) showing significant changes at juvenile (Juv) and adult (Ad) stages within (coloured p) or among (black p) genotypes. n = 3 fish/genotype, n = 30–50 adult myofibre/fish, n = 15–20 juvenile myofibre/fish, one-way ANOVA.
|

