FIGURE SUMMARY
Title

Midkine-a functions as a universal regulator of proliferation during epimorphic regeneration in adult zebrafish

Authors
Ang, N.B., Saera-Vila, A., Walsh, C., Hitchcock, P.F., Kahana, A., Thummel, R., Nagashima, M.
Source
Full text @ PLoS One

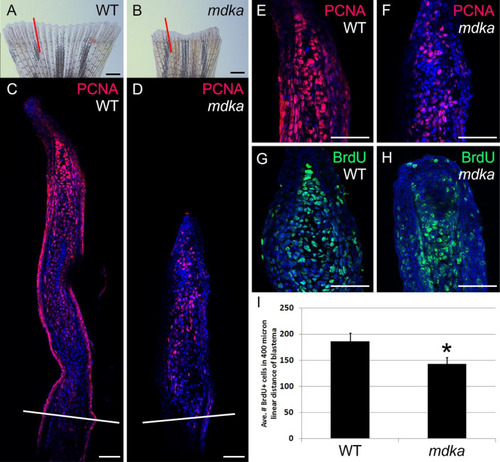
Initial proliferation is diminished in <italic>mdka</italic><sup><italic>mi5001</italic></sup> following fin amputation.

(A-D) Stereo and confocal microscope images of regenerating fins in wildtype (A,C) and mdkami5001 (B,D), immunolabeled with PCNA (magenta). Red lines (A,B) indicate the plane of cross section shown in panels C and D. White lines across the fins show the levels of the amputation plane (C,D). Scale bars equal 400 μm in (A,B) and 50 μm in (C,D). (E-H) Confocal images of the blastemal compartments of fins from wildtype (E,G) and mdkami5001 (F,H), immunolabeled with PCNA (E,F) or BrdU (G,H) incorporated between 3–4 dpa (see Materials and Methods). Scale bars equal 50 μm in (E-H). (I) Graph illustrating the average number of BrdU-positive cells within a 400 mm linear distance. wildtype: 186.8 ± 15.1 cells, mdkami5001: 142.9 ± 12.3 cells, Student’s t-test, p = 0.0326, n = 5 wildtype and 5 mutants.

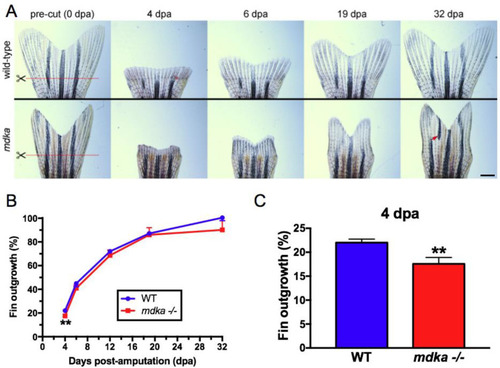
Initial fin regeneration is delayed but recovers in <italic>mdka</italic><sup><italic>mi5001</italic></sup>.

(A) Fins from wildtype (top) and mdkami5001 (bottom) at 0, 4, 6, 19, and 32 dpa. Red lines indicate the level of the amputation plane. In wildtype animals, the structure of the bony fin rays and pigmentation recover completely. Compared to age-matched group of wildtype, pre-amputated fin in the mdkami5001 is smaller in size (wildtype: 51.3 ± 7.1 μm2; mdkami5001: 34.3 ± 4.7 μm2, p<0.0001, Student’s t-test). In the mutants, regenerated fins display abnormal shape and mis-patterned melanophore pigmentation (red arrow). Scale bar equals 400 μm. (B) Graph illustrating the average percent outgrowth through 32 dpa, calculated from the ratio of the areas of pre- and post-amputation fins. Wildtype fins recover to 100% of pre-amputation levels by 32 dpa. The mutant animals show a significant reduction of fin outgrowth at 4 dpa. At the subsequent time points, there is no statistically significant difference in the fin outgrowth between wildtype and mdkami5001. (C) Graph illustrating the percent fin outgrowth at 4 dpa in wildtype and mdkami5001. Student’s t-test, p = 0.0105. n = 9 wildtype and 8 mutants.

Regeneration of the extraocular muscle is delayed in <italic>mdka</italic><sup><italic>mi5001</italic></sup>.

(A) qPCR for midkine-a in wildtype zebrafish at 48 hours post lesion. Student’s t-test, p*<0.05, n = 3 uninjured and 3 injured (10 muscles per sample). (B) Cell counts of EdU labeled cells in muscles at 24 hours post lesion from wildtype (n = 4) and mdkami5001(n = 4). Student’s t-test, p*<0.05. (C) Diagram of the craniectomized head of an adult zebrafish. Red lines identify the lateral rectus muscles. Excised muscle is represented as red dashed line. Asterisk identifies the pituitary body at the midline. Boxes represent areas illustrated in panels D and E. (D) EdU-labeled cells in muscles from wildtype (top) and mdkami5001 (bottom) at 24 hours post lesion. High magnification inset image illustrates an elongated myonucleus undergoing proliferation (also see [13]). Arrows indicate the growing tip of the regenerating muscle. Asterisk indicates the pituitary body at the midline. (E) Extraocular muscles are outlined by dashed lines in control animals and in mutants at 4 days post lesion. Asterisks identify the pituitary body. (F) Outgrowth of regenerating muscles at post-injury time points in wildtype and mdkami5001. One-way ANOVA followed by Newman-Keuls multiple comparisons test, p*<0.05, p**<0.01, n = 4 wildtype and 4 mutants.

Proliferation of Müller glia is compromised following a stab wound in <italic>mdka</italic><sup><italic>mi5001</italic></sup>.

(A-D) Immunocytochemistry for proliferative marker, PCNA, in wildtype (A,B) and mdkami5001 (C,D) at post-lesion time points. (E-G) Graphs illustrating the number of PCNA-positive cells in the outer nuclear layer (E; 48 hpl, wildtype: 20.9 ± 3.7 cells, mdkami5001: 2.6 ± 2.1 cells, p = 0.0016; 72 hpl, wildtype: 18.5 ± 5.8 cells, mdkami5001: 3.8 ± 1.1 cells, p = 0.0126), inner nuclear layer (F; 48 hpl, wildtype: 50.7 ± 11.9 cells, mdkami5001: 4.4 ± 5.3 cells, p = 0.0036; 72 hpl, wildtype: 43.7 ± 9.7 cells, mdkami5001: 8.9 ± 7.3 cells, p = 0.0077), and total retinal layer (G; 48 hpl, wildtype: 72.1 ± 12.9 cells, mdkami5001: 7.1 ± 6.3 cells, p = 0.0014; 72 hpl, wildtype: 56.4 ± 19.1 cells, mdkami5001: 12.8 ± 8.0 cells, p = 0.0212). Scale bar equals 60 μm. Student’s t-test, p*<0.05, n = 3 wildtype and 3 mutants. ONL: outer nuclear layer; INL: inner nuclear layer.

Absence of proliferation in <italic>mdka</italic><sup><italic>mi5001</italic></sup> following the death of inner retinal neurons.

(A, B) Immunocytochemistry for the cell marker, HuC/D, in wildtype (A) and mdkami5001 (B) at 72 hpi. (C) The number of HuC/D-positive cells following the injection of PBS (wildtype: 241.3 ± 28.2 cells, mdkami50011: 206.0 ± 12.4 cells) and ouabain (wildtype: 25.8 ± 10.5 cells, mdkami5001: 17.2 ± 7.2 cells, p = 0.137) retinas. (D, E) Immunocytochemistry for proliferative marker, PCNA in wildtype (D) and mdkami5001 (E) at 72 hpi. (F) The number of PCNA-positive cells per 500 μm in wildtype (54.4 ± 14.2 cells) and mdkami5001 (17.1 ± 6.4 cells. p = 0.00246) at 72 hpi. Student’s t-test, p*<0.05, n = 9 wildtype and 9 mutants. ONL: outer nuclear layer; INL: inner nuclear layer.

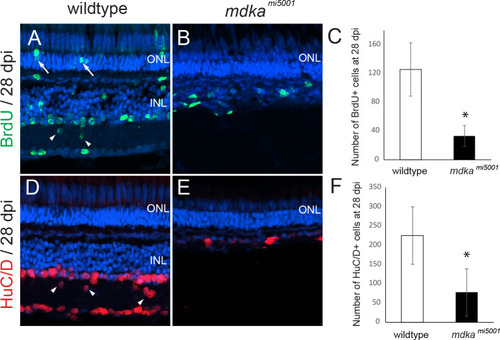
Absence of retinal regeneration in <italic>mdka</italic><sup><italic>mi5001</italic></sup> at 28 dpl following the death of inner retinal neurons.

(A, B) BrdU-labeled regenerated retinal neurons in wildtype (A) and mdkami5001 (B) retinas at 28 dpi. Arrows indicated BrdU-labeled rod photoreceptors. (C) The number of BrdU-positive cells wildtype (125.2 ± 37.1 cells) and mdkami5001 (33.2 ± 14.4 cells, p = 0.000341) retinas at 28 dpi. (D,E) Regenerated inner neurons labeled with HuC/D in wildtype (D) and mdkami5001 (E) at 28 dpi. Arrowheads indicate regenerated inner neurons are displaced in the inner plexiform layer. (F) The number of HuC/D cells in wildtype (224.8 ± 74.6 cells) and mdkami5001 (76.8 ± 61.4 cells, p = 0.00021) at 28 dpi. Student’s t-test, p*<0.05, n = 9 wildtype and 9 mutants. ONL: outer nuclear layer; INL: inner nuclear layer.

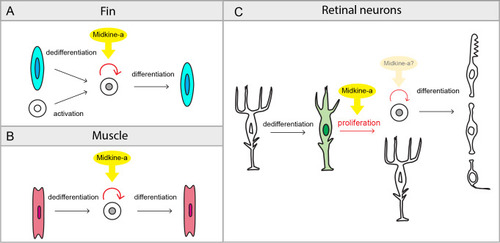
Summary diagram: The function of Midkine-a during epimorphic regeneration.

(A,B) Following fin amputation, Midkine-a regulates proliferation of precursors produced from dedifferentiation of osteoblasts and activation of mesenchymal stem and progenitors (A). Following extraocular muscle excision, Midkine-a regulates proliferation of precursor produced from dedifferentiation of myocyte (B). During fin and muscle regeneration, loss of Midkine-a results in diminished initial burst of proliferation. (C) During regeneration of retinal neurons, Midkine-a governs proliferation of dedifferentiated Müller glia. In the absence of Midkine-a, retinal neurons fail to regenerate.

Acknowledgments
This image is the copyrighted work of the attributed author or publisher, and ZFIN has permission only to display this image to its users. Additional permissions should be obtained from the applicable author or publisher of the image. Full text @ PLoS One