FIGURE SUMMARY
Title

A Novel Cre-Enabled Tetracycline Inducible transgenic system for tissue specific cytokine expression in the zebrafish: CETI-PIC3

Authors
Ibrahim, S., Harris-Kawano, A., Haider, I., Mirmira, R.G., Sims, E.K., Anderson, R.M.
Source
Full text @ Dis. Model. Mech.

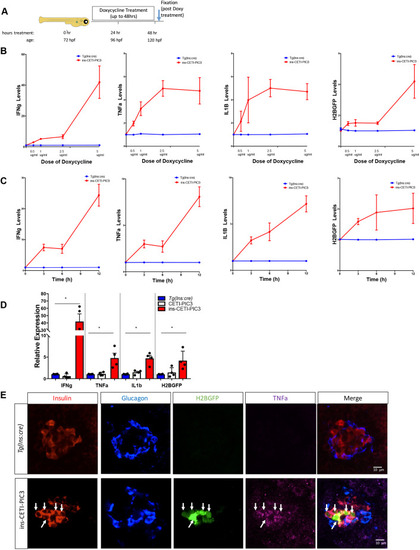
The transcript levels of cytokines are increased and tissue-specific induction of cytokines is achieved within the induced ins-CETI-PIC3 model system. (A) Schematic for the experimental procedure. All treatments were performed at 72 h post-fertilization (hpf). For B, C and D, RNA was subsequently isolated from the whole bodies of at least 15 embryos in each clutch and all analysis was performed on whole-body samples. (B) Dose response to 0, 0.5, 1 and 2.5 µg/ml doxycycline is shown for tnfa, ifng1 and il1b, and H2B-GFP. (C) Time response to 5 µg/ml doxycycline is shown for up to 12 h after treatment with doxycycline. All experiments for D and E were performed in ins-CETI-PIC3 experimental embryos and clutch-mate control Tg(ins:cre) or CETI-PIC3 embryos treated with 5 µg/ml doxycycline for 48 h. (D) The levels of tnfa, ifng1 and il1b, and H2B-GFP are all increased after doxycycline induction in the ins-CETI-PIC3 embryos compared to Tg(ins:cre) and CETI-PIC3 control embryos. n=4. *P<0.05 (one-way ANOVA). (E) After crossing the CETI-PIC3 line to the Tg(ins:cre) line, β cell-specific induction of the cytokines occurred, as seen by the H2B-GFP signal and Tnfa staining only in the Insulin-positive cells (arrows).

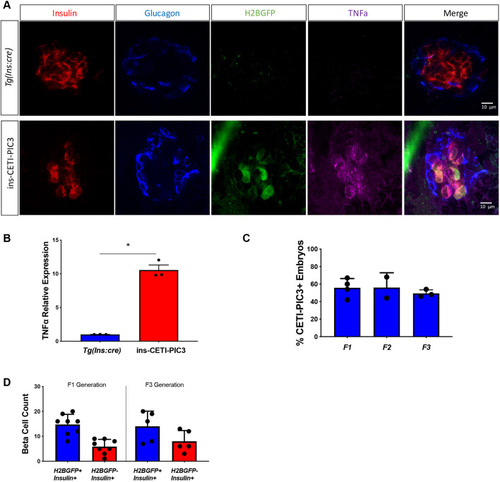
The efficiency and effects of the CETI-PIC3 systemarepreserved in subsequent generations. (A) Embryos from an F3 generation of the CETI-PIC3 line were crossed to the Tg(ins:cre) line. β cell-specific induction of H2B-GFP was observed and Tnfa staining was enriched within β cells. (B) qRT-PCR analysis demonstrates increase in tnfa transcript levels in this generation of embryos. n=3. *P<0.05 (parametric t-test). (C) The percentage of transgenic embryos from each generation, up to the F3 generation. (D) Quantification of Insulin+ H2B-GFP+ double-positive cells and Insulin+ H2B-GFP single-positive cells in ins-CETI-PIC3 embryos from F1 and F3 generations to show how responsive CETI-PIC3 embryos are to insulin:cre.

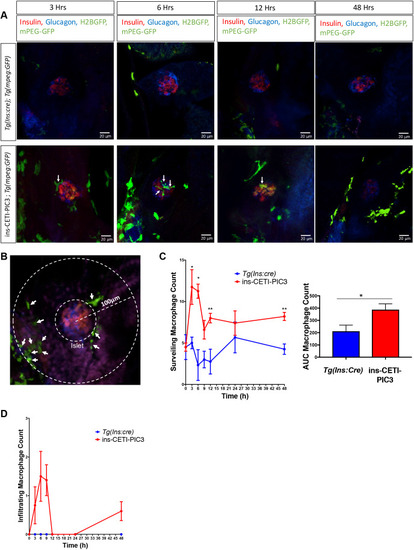
Cytokine-induced embryos have increased macrophage surveillance and infiltration compared to clutch-mate controls. (A) ins-CETI-PIC3 embryos were crossed to the Tg(mpeg:GFP) line that marks macrophages with a GFP tag. CETI-PIC3;ins:cre;Tg(mpeg:GFP) triple-positive embryos were compared to Tg(ins:cre);Tg(mpeg:GFP) control embryos. All embryos were treated with 5 µg/ml doxycycline for different time periods (0-48 h). Infiltrating macrophages are marked with arrows. (B) Schematic for how macrophages were counted. All macrophages within a 100-μm radius of the center of the islet were counted. All macrophages within that radius but outside the islet itself were considered surveilling macrophages (arrows) and all macrophages within the islet were considered infiltrating macrophages. (C) ins-CETI-PIC3 embryos display increased surrounding surveilling macrophages in a time-dependent manner. n=4-5 embryos. *P<0.05, **P<0.01 (parametric t-test). (D) Areas under the curves were calculated to quantify macrophage numbers for multiple embryos and showed that increased infiltrating macrophages were observed in ins-CETI-PIC3 embryos in a time-dependent manner. n=4-5 embryos.

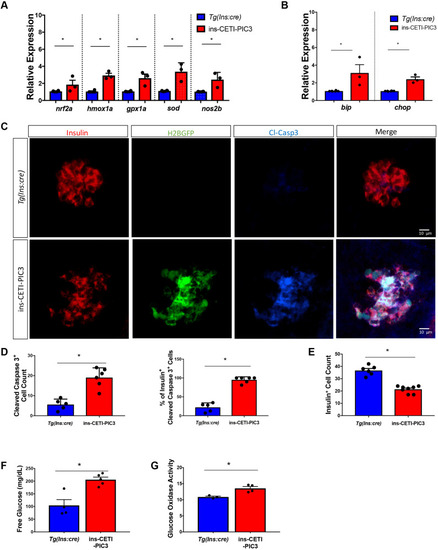
Cytokine-induced embryos display increased transcript levels for markers of ROS-mediated and ER stress, and increased β cell death, and are hyperglycemic compared to clutch-mate controls. All experiments in these panels were performed in ins-CETI-PIC3 experimental embryos and clutch-mate control Tg(ins:cre) embryos treated with 5 µg/ml doxycycline for 48 h. (A) Several members involved in the ROS-mediated stress pathway – such as nrf2a, hmox1a, gpx1a, sod and nos2b – were also increased after induction of the pro-inflammatory cytokines n=3. *P<0.05 (parametric t-test). (B) Members of the ER stress pathway, such as bip and chop, were increased following cytokine induction. n=3. *P<0.05 (parametric t-test). (C) There is increased Cleaved caspase 3 staining in ins-CETI-PIC3 embryos compared to Tg(ins:cre) controls. (D) The number of Cleaved caspase3+ cells per islet is increased in the ins-CETI-PIC3 embryos. n=6. *P<0.05 (parametric t-test). (E) The Insulin+ cell count is decreased in the ins-CETI-PIC3 embryos. (F) Free glucose levels in ins-CETI-PIC3 embryos are higher than those in Tg(ins:cre) controls. n=5. *P<0.05 (parametric t-test). (G) Glucose oxidase activity, an indicator of free blood glucose, is higher in ins-CETI-PIC3 embryos. n=4. *P<0.05 (parametric t-test).

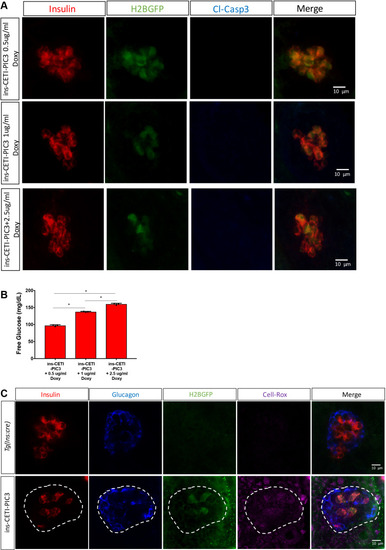
Hyperglycemia is induced without overt β cell death and ROS-mediated stress is seen in surrounding cells of the islet. (A) After treatment with 0.5, 1 and 2.5 µg/ml doxycycline, there was no subsequent increase in Casp3* expression in these embryos. (B) A hyperglycemic phenotype was observed in embryos treated with 1 µg/ml and 2.5 µg/ml doxycycline. n=3. *P<0.05 (individual t-tests). (C) The expression of CellRox Deep Red is enriched in β cells and is also observed in surrounding cells of the islet (outlined by dashed lines).

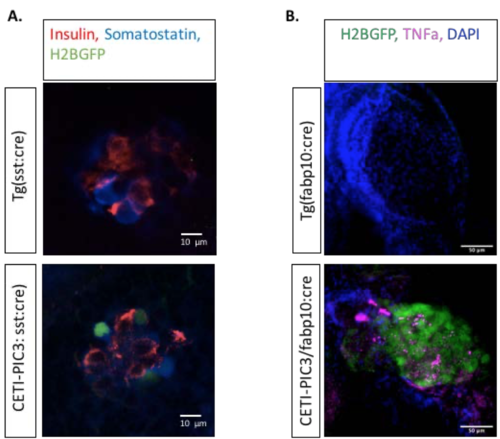
(A) The CETI-PIC3 line was crossed to a somatostatin-cre (Tg(sst:cre)) line to induce cytokines in a delta cell-specific manner. (B) The CETI-PIC3 line was crossed to a liver-cre line (fabp10:cre) to induce cytokines in a hepatocyte-specific manner.

Acknowledgments
This image is the copyrighted work of the attributed author or publisher, and ZFIN has permission only to display this image to its users. Additional permissions should be obtained from the applicable author or publisher of the image. Full text @ Dis. Model. Mech.