IMAGE

Fig. 2.

ID
ZDB-IMAGE-200703-12
Source
Figures for Ibrahim et al., 2020
Image
Figure Caption

Fig. 2.

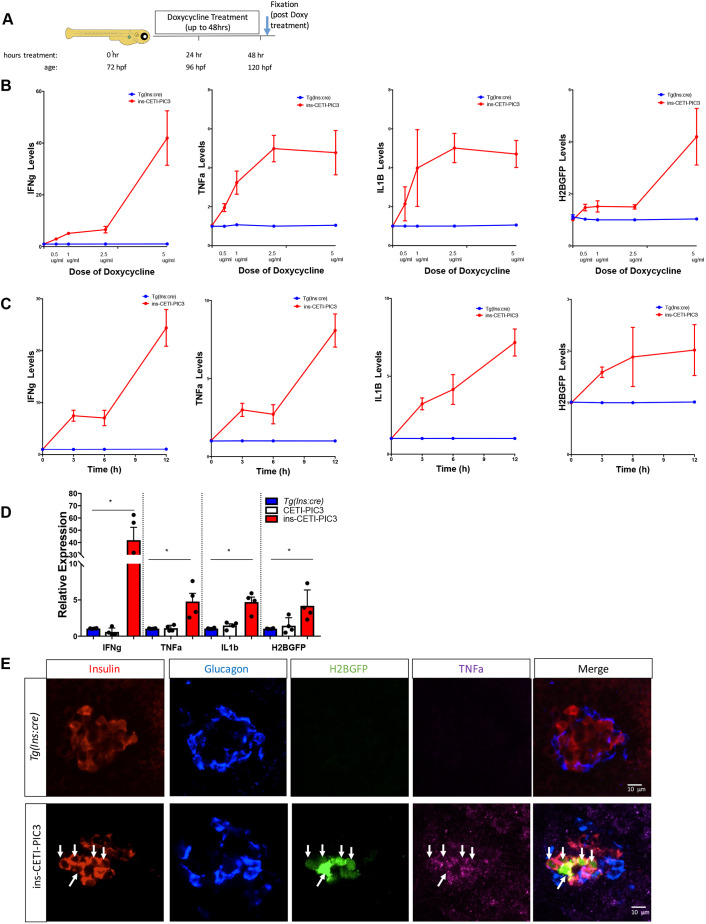
The transcript levels of cytokines are increased and tissue-specific induction of cytokines is achieved within the induced ins-CETI-PIC3 model system. (A) Schematic for the experimental procedure. All treatments were performed at 72 h post-fertilization (hpf). For B, C and D, RNA was subsequently isolated from the whole bodies of at least 15 embryos in each clutch and all analysis was performed on whole-body samples. (B) Dose response to 0, 0.5, 1 and 2.5 µg/ml doxycycline is shown for tnfa, ifng1 and il1b, and H2B-GFP. (C) Time response to 5 µg/ml doxycycline is shown for up to 12 h after treatment with doxycycline. All experiments for D and E were performed in ins-CETI-PIC3 experimental embryos and clutch-mate control Tg(ins:cre) or CETI-PIC3 embryos treated with 5 µg/ml doxycycline for 48 h. (D) The levels of tnfa, ifng1 and il1b, and H2B-GFP are all increased after doxycycline induction in the ins-CETI-PIC3 embryos compared to Tg(ins:cre) and CETI-PIC3 control embryos. n=4. *P<0.05 (one-way ANOVA). (E) After crossing the CETI-PIC3 line to the Tg(ins:cre) line, β cell-specific induction of the cytokines occurred, as seen by the H2B-GFP signal and Tnfa staining only in the Insulin-positive cells (arrows).

Acknowledgments
This image is the copyrighted work of the attributed author or publisher, and ZFIN has permission only to display this image to its users. Additional permissions should be obtained from the applicable author or publisher of the image. Full text @ Dis. Model. Mech.