- Title
-
The conserved and divergent roles of Prdm3 and Prdm16 in zebrafish and mouse craniofacial development
- Authors
- Shull, L.C., Sen, R., Menzel, J., Goyama, S., Kurokawa, M., Artinger, K.B.
- Source
- Full text @ Dev. Biol.
|
Genetic ablation of PRDM3 causes subtle craniofacial defects in zebrafish and mid-gestation lethality in mice. (A?E) Wildtype and prdm3?/? zebrafish embryos were collected at 6 dpf and stained for Alcian blue and Alizarin red. (A) Images of dissected viscerocranium and neurocranium of wildtype (wt) and prdm3?/? embryos. prdm3?/? embryos and their cartilage phenotypes were present in Mendelian ratios (B). (C?F) Quantification of cartilage elements, Meckel?s cartilage to palatoquadrate (horizontal black double arrow in wt viscerocranium of A) (C), distance between trabeculae (vertical black double arrow in wt neurocraium of A) (D), length of parashenoid tissue (E), and area of mineralized parasphenoid (F). ceratobranchial arches (cbs), ceratohyal (ch), Meckel?s cartilage (m), opercle (op), palatoquadrate (pq), parasphenoid (ps), trabeculae (tr), (n ?= ?6 for each group measured). Scale bar, 100 ??m. (G?H) Ventral views of in situ hybridization for col2a1 (G) and dorsal views of in situ hybridization for runx2b (H) in prdm3 mutants or wildtype controls at 48 hpf. ceratobranchial arch 5 (cb5), cleithrum (cl), eye (e), opercle (op). Black arrow heads indicate decreased expression in the cartilage and bone elements of the neurocranium and viscerocranium. Scale bar, 250 ??m. (I?J) Prdm3fl/fl females were bred for timed matings to Prdm3?/+;Sox2+/Tg males and embryos were collected at the indicated timepoints. Shown are lateral (top) and ventral (bottom) gross phenotypes of mutant animals (I). Scale bar 750 ??m. (J) Prdm3?/?;Sox2+/Tg and control embryos were collected at E13.5 and stained with Alcian blue. Shown are lateral views of the head. Meckel?s cartilage (mc). *p ?? ?0.05, **p ?? ?0.005, #p ?? ?0.1, Student?s t-test. |
|
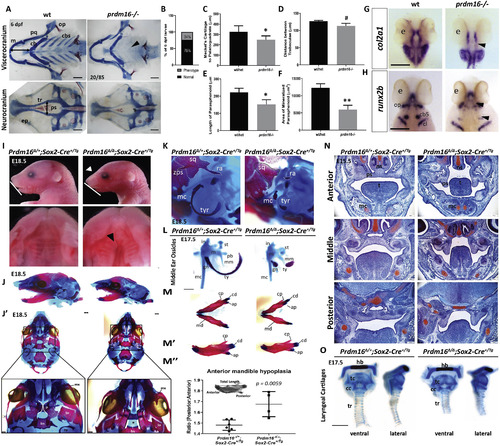
Loss of PRDM16 causes craniofacial defects in zebrafish and mice. (A?E) Wildtype and prdm16?/? zebrafish embryos were collected at 6 dpf and stained for Alcian blue and Alizarin red. (A) Images of dissected viscerocranium and neurocranium of wildtype (wt) or prdm16?/? embryos. Prdm16?/? embryos and their cartilage phenotypes were present in Mendalian ratios (B). (C?F) Quantification of cartilage elements, Meckel?s cartilage to palatoquadrate (C), distance between trabeculae (D), length of parasphenoid tissue (E), and area of mineralized parasphenoid (F). ceratobranchial arches (cbs), ceratohyal (ch), Meckel?s cartilage (m), palatoquadrate (pq), parasphenoid (ps), trabeculae (tr), (n ?= ?6 for each group measured). Scale bar, 100 ??m. (G?H) Ventral views of in situ hybridization for col2a1 (G) and dorsal views of in situ hybridization for runx2b (H) in prdm16 mutants or wildtype controls at 48 hpf. eye (e), ceratobranchial arch 5 (cb5), cleithrum (cl), opercle (op). Black arrow heads denote areas of reduced expression of these markers in the developing cartilaginous structures. Scale bar, 250 ??m. (I?O) Prdm16fl/fl females were bred for timed matings to Prdm16?/+;Sox2+/Tg males and embryos were collected at the indicated timepoints. (I) Lateral images of the head show snout defects (white arrowhead) and hypoplasia of the mandible (white line) in Prdm16 mutant animals at E18.5 (top). Dissected palates reveal clefting in a subset of Prdm16 mutants (black arrowheads). (J?M) Alcian blue and Alizarin red stained whole mounts of control and mutants at E18.5. (J) Lateral views of the cranial skeleton. (J?) Ventral views of the cranial skeleton with the mandible removed with higher magnification images of the palantine bone shown below (black star indicates clefting in mutant). Scale bars, 1 ?mm. (K) High magnification lateral views of the middle ear and squamosal bone structures. (L) Middle ear ossicles were dissected and removed from control or Prdm16 mutant mice to reveal severe hypoplasia of the malleus, incus and tympanic ring in mutant animals. Scale bar, 0.5 ?mm. (M-M?) Mandibles were dissected and removed from control or mutant animals. (M?) Lateral views of the right half of the mandible. (M?) Quantification of anterior mandible hypoplasia by measuring the ratio between the anterior and posterior portions of the mandible (P:A). (N) Safranin O and Fast Green stained coronal sections through the anterior-posterior axis of the developing palate at E15.5 in control or mutant mice. Scale bars, 250 ??m. (O) Dissected and removed laryngeal cartilages from control and Prdm16 mutant embryos at E17.5 Abbreviations: angular process (ap), basisphenoid (bs), condylar process (cd), coronoid process (cp), cricoid cartilage (cc), gonial (gn), hyoid bone (hb), incus (i), lamina obturans (lo), malleus (m), mandible (md), manubrium of the malleus (mm), maxilla (mx), Meckel?s cartilage (mc), nasal septum (ns), palantine (p), palatal shelf (ps), processus brevis (pb), retroarticular process of the squamosal bone (ra), stapes (st), squamosal bone (sq), thyroid cartilage (tc), tongue (t), tracheal rings (tr), tympanic ring (tyr), zygomatic process of the squamosal bone (zps). *p ?? ?0.05, **p ?? ?0.005, #p ?= ?0.189, Student?s t-test. EXPRESSION / LABELING:
PHENOTYPE:
|
|
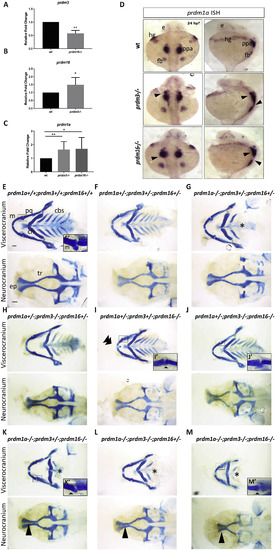
prdm1a, prdm3, and prdm16 genetically compensate for each other in zebrafish craniofacial development. (A?C) RNA was isolated from the heads of prdm3?/?, prdm16?/? or wildtype embryos at 48 hpf. RT-qPCR was performed for prdm3 (A), prdm16 (B) or prdm1a (C). 5?10 genotyped heads were pooled for RNA. (n ?= ?3 replicate experiments). (D) Dorsal and lateral views of in situ hybridization for prdm1a in prdm3 and prdm16 mutants at 24 hpf. (E?M) prdm1a+/-;prdm3+/?;prdm16+/- ?triple heterozygous fish were generated and intercrossed. Embryos were collected and stained at 4 dpf with Alcian blue. Shown are dissected and mounted viscerocranium and neurocranium tissues from different allelic combinatorial mutants indicated. Selected inserts (E?, I?-K?, M?) show high magnification images of the jaw joints. Double arrowhead indicates ectopic cartilage, black star indicates loss of posterior ceratobranchial arches, single short black arrowhead indicates abnormal jaw joint, single long black arrowhead indicates clefting in the ethmoid plate. Abbreviations: ceratobranchial arches (cbs), ceratohyal (ch), ethmoid plate (ep), eye (e), fin bud (fb), hatching gland (hg), Meckel?s cartilage (m), palatoquadrate (pq), posterior pharyngeal arches (ppa), trabeculae (tr). Scale bar, 100 ??m *p ?? ?0.05, **p ?? ?0.005, Student?s t-test. PHENOTYPE:
|
|
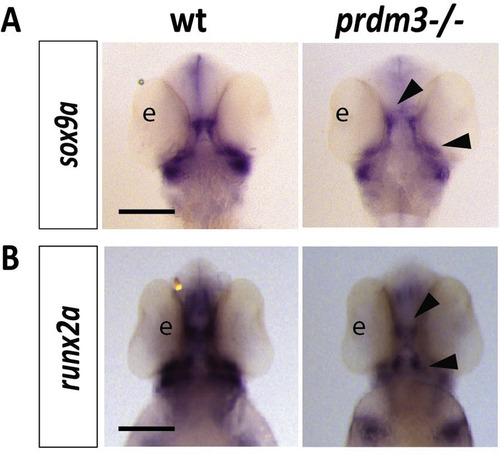
Cartilage and bone markers, sox9a and runx2a, are reduced in the pharyngeal arches with loss of prdm3 in zebrafish. (A-B) Wildtype or prdm3?/? mutant embryos were collected and in situ hybridization was performed for sox9a (A) or runx2a (B) at 48 hpf. Shown are ventral views for each transcript. Black arrow heads indicate areas of decreased expression of these markers in the developing viscerocranium and neurocranium. Scale bars, 250 ??m. Abbreviations: eye (e). |
|
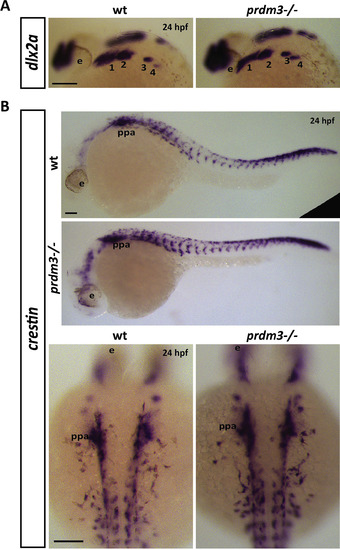
Neural crest markers, dlx2a and crestin, are unchanged in the pharyngeal arches with loss of prdm3 in zebrafish. (A-B) Wildtype or prdm3?/? mutant embryos were collected and in situ hybridization was performed for dlx2a (A) or crestin (B) at 24 hpf. Shown are lateral views of dlx2a expression in the pharyngeal arches (1?4) (A) and lateral views of crestin across the whole body to show neural crest migration is unaffected in prdm3 mutant zebrafish. Higher magnification, dorsal views of crestin expression is also shown in (B). Scale bars, 100 ??m. Abbreviations: eye (e), 1?4 (pharyngeal arches 1?4), posterior pharyngeal arches (ppa). |
|
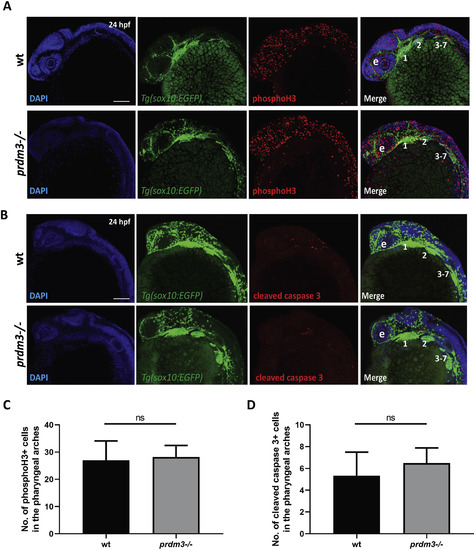
Loss of prdm3 does not lead to changes in pharyngeal arch cell proliferation or cell death. (A-D) Wildtype or prdm3?/? zebrafish embryos crossed into the Tg(sox10:EGFP) transgenic line were collected at 24 hpf and whole mount immunofluorescence was performed for phosphorylated histone H3 (A) or cleaved caspase 3 (B) to assess cell proliferation or apoptosis in the pharyngeal arches, respectively. Shown are lateral max projection images of the pharyngeal arches 1?7. (C-D) Quantification of the number of phosphorylated histone H3 positive cells (yellow) (C) or cleaved caspase 3 positive cells (yellow) (D) within the pharyngeal arches (n ?= ?6 embryos for each group). Abbreviations: eye (e), pharyngeal arches (1?7). Scale bar, 100 ??m ?ns, not significant, Student?s t-test. |
|
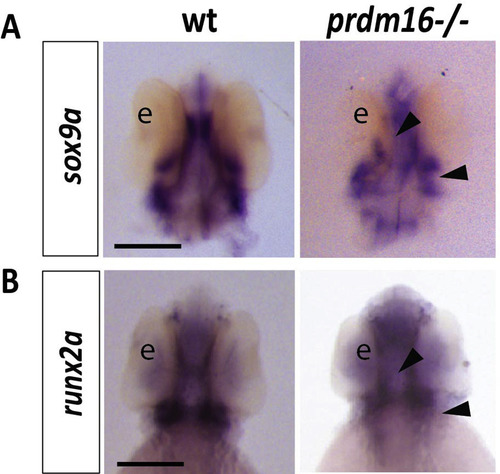
Loss of prdm16 decreases expression of cartilage and bone markers, sox9a and runx2a, in zebrafish. (A-B) Wildtype or prdm16?/? mutant embryos were collected and in situ hybridization was performed for sox9a (A) or runx2a (B) at 48 hpf. Shown are ventral views for each transcript. Black arrow heads indicate areas of reduced expression of these transcripts in the developing cartilage and bone structures of the craniofacial skeleton. Scale bars, 250 ??m. Abbreviations: eye (e). |
|
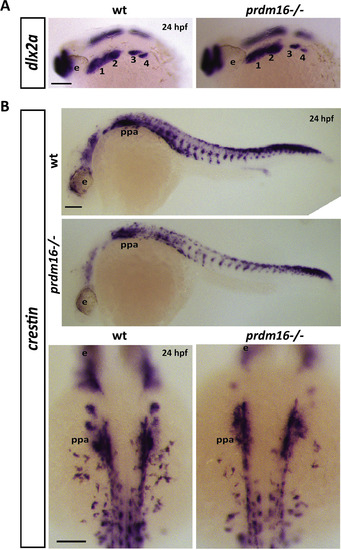
Loss of prdm16 causes a subtle decrease in expression of neural crest markers dlx2a or crestin in the pharyngeal arches. (A-B) Wildtype or prdm16?/? mutant embryos were collected and in situ hybridization for dlx2a (A) or crestin (B) was performed at 24 hpf. Shown are lateral views of dlx2a expression in the pharyngeal arches (1?4) (A) and lateral views of crestin across the whole body to show neural crest migration is unchanged in prdm16 mutant zebrafish. Higher magnification, dorsal views of crestin expression is also shown in (B). Scale bars, 100 ??m. Abbreviations: eye (e), 1?4 (pharyngeal arches 1?4), posterior pharyngeal arches (ppa). |
|
Cell proliferation and cell death are not affected in the pharyngeal arches with loss of prdm16. (A-D) Wildtype or prdm16?/? zebrafish embryos crossed into the Tg(sox10:EGFP) transgenic line were collected at 24 hpf and whole mount immunofluorescence was performed for phosphorylated histone H3 (A) or cleaved caspase 3 (B) to assess cell proliferation or apoptosis in the pharyngeal arches, respectively. Shown are lateral max projection images of the pharyngeal arches 1?7. (C-D) Quantification of the number of phosphorylated histone H3 positive cells (yellow) (C) or cleaved caspase 3 positive cells (yellow) (D) within the pharyngeal arches (n ?= ?6 embryos for each group). Abbreviations: eye (e), pharyngeal arches (1?7). Scale bar 100 ??m ?ns, not significant, Student?s t-test. |
|
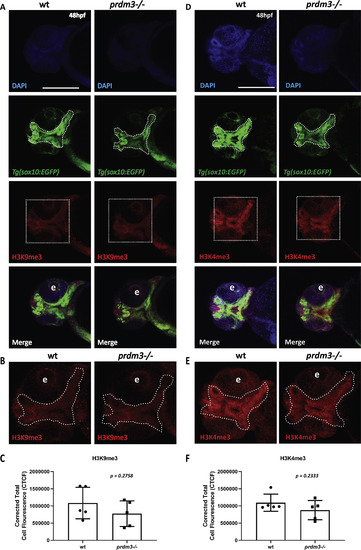
Loss of prdm3 decreases trimethylation of histone H3 substrates in zebrafish cranial pharyngeal arch derivatives. (A-F) Wildtype or prdm3?/? zebrafish embryos crossed into the Tg(sox10:EGFP) transgenic line were collected at 48 hpf and whole mount immunofluorescence was performed for trimethylated H3 lysine 9 (A-C) or trimethylated H3 lysine 4 (D-F). Shown are ventral confocal max projection images of the head. (B, E) Zoomed images of H3K9me3 or H3K4me3 signal. (C, F) Quantification of the corrected total mean fluorescence intensity of H3K9me3 (C) or H3K4me3 (F) in the pharyngeal arch-derived craniofacial structures outlined with dotted line in (B) and (E) from 5 different embryos for each genotype and each mark. Abbreviation: eye (e). Scale bar 150 ??m p values shown above, Student?s t-test. |
|
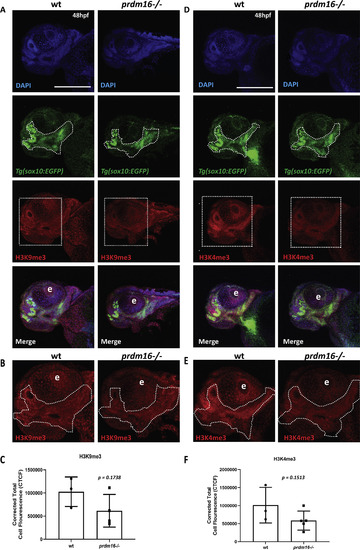
Loss of prdm16 reduces trimethylation of histone H3 substrates in zebrafish pharyngeal arch derived craniofacial structures. (A-F) Wildtype or prdm16?/? zebrafish embryos crossed into the Tg(sox10:EGFP) transgenic line were collected at 48 hpf and whole mount immunofluorescence was performed for trimethylated H3 lysine 9 (A-C) or trimethylated H3 lysine 4 (D-F). Shown are ventral confocal max projection images of the head. (B, E) Zoomed images of H3K9me3 or H3K4me3. (C, F) Quantification of the corrected total mean fluorescence intensity of H3K9me3 (C) or H3K4me3 (F) in the pharyngeal arch-derived craniofacial structures outlined with dotted line in (B) and (E) from 3 to 5 different embryos for each genotype and each mark. Abbreviation: eye (e). Scale bar 150 ??m p values shown above, Student?s t-test. |
Reprinted from Developmental Biology, 461(2), Shull, L.C., Sen, R., Menzel, J., Goyama, S., Kurokawa, M., Artinger, K.B., The conserved and divergent roles of Prdm3 and Prdm16 in zebrafish and mouse craniofacial development, 132-144, Copyright (2020) with permission from Elsevier. Full text @ Dev. Biol.


